In our post yesterday, we reported on the good news from the 2013 Australian Aid Stakeholder survey. Most of the 356 experts and practitioners we surveyed are positive about the effectiveness of Australian aid, and they think that the sectoral and geographic priorities of the program are largely right.
But the survey also reveals that all is not well in the world of Australian aid. The first sign of this actually comes in the results we presented yesterday. On a scale of 1 to 5, the question of how our aid compares to the OECD average in terms of effectiveness scores only 3.3, just above a bare pass. In 2011, when launching the new Australian aid strategy, then Foreign Minister Rudd said that he wanted “to see an aid program that is world-leading in its effectiveness”. Clearly we have a long way to go in realizing that aspiration.
We also asked people about both the 2011 Australian aid strategy and the implementation of that strategy. Respondents are largely satisfied with the strategy (it gets a score of 3.7, which is good given that scores rarely exceed 4), but much less so with its implementation, which gets a score of only 3.2, again close to a bare pass.
The sense that there is an unfinished aid reform agenda comes most clearly from the series of questions we asked about 17 aid program “attributes”. We picked these up from the 2011 Independent Review of Aid Effectiveness. They are factors that are required for an effective and strong aid program, and ones that were identified as important in the Australian context by the Aid Review.
You can find the details on all 17 attributes in our report. They can be grouped into four categories of aid challenges:
- Enhancing the performance feedback loop: ensuring better feedback, and that the systems and incentives are in place to respond to that feedback.
- Managing the knowledge burden: ensuring that you have the staff and the partnerships to cope with the massive knowledge demands (across countries and sectors) that effective aid requires.
- Limiting discretion: ensuring that aid-funded efforts aren’t spread too thin.
- Building popular support for aid: ensuring that political leadership and community engagement is in place.
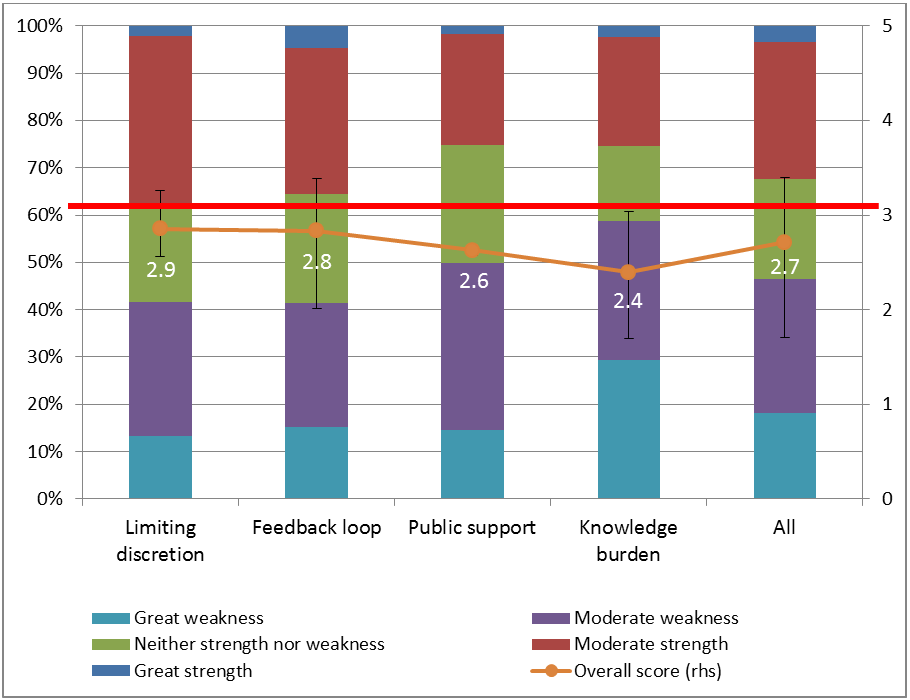
By taking the average score for the attributes within each of the four categories, we can rate how well the aid program is doing in in each of these four areas. The figure below uses the same method as the graphs in yesterday’s post. The columns show averages by category for the proportion of participants responding with each of the 5 options available in relation to each of the 17 aid program attributes: a great weakness; a weakness; neither a weakness nor a strength; a strength; or a great strength. We also assign each response a score from a great weakness (1) to a great strength (5). Averaging across all respondents gives us an average or overall score, where 5 is the maximum, 1 the minimum and 3 a bare pass – indicated by the red line. These scores are shown by the line graph in the figure below. The error bars show the ranges for individual attributes within each of the four categories.
 None of the four categories achieved an average score of 3, a pass mark. The worst-performing was managing the knowledge burden, which achieved a mark of only 2.4, but even the best, limiting discretion, got an average score of only 2.9. The average across all 17 attributes was just 2.7.
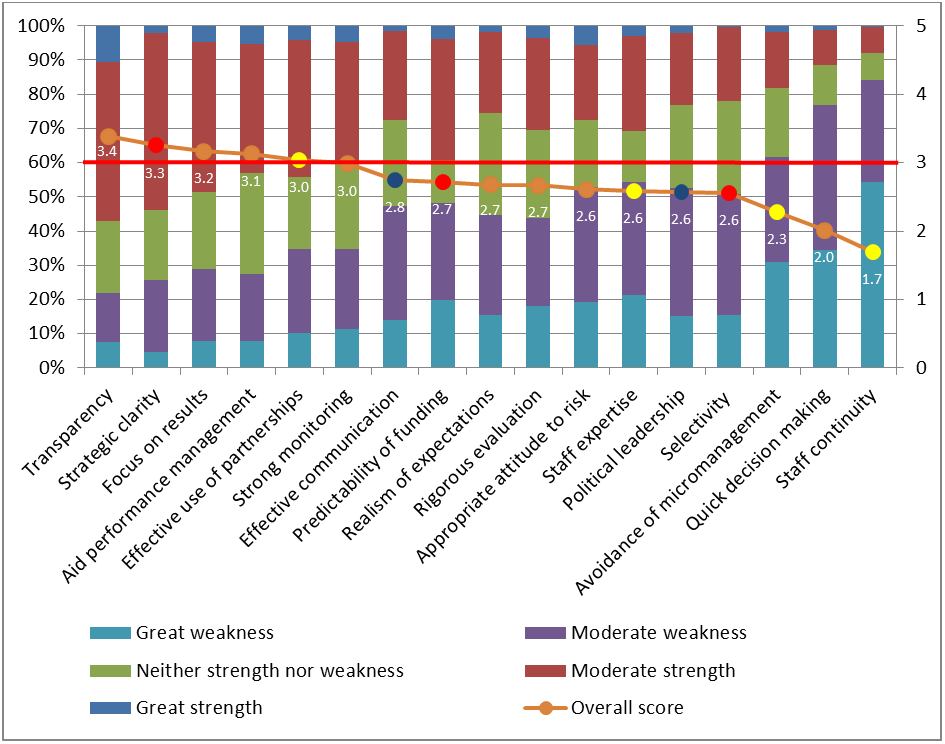
The next graph shows the scores for each of the 17 attributes. The one viewed as the greatest strength of the aid program was transparency, which got a score of 3.4, but only six got a score of 3 or above. 11 got a score below 3. Staff continuity was seen as the biggest weakness with a score of only 1.7.
 Note: Tan markers are in the enhancing performance feedback loop category (8 attributes); red are in the limiting discretion category (3 attributes); yellow are in the managing knowledge category (4 attributes); and blue are in the building support category (2 attributes).
It is interesting to analyse which attributes did better than others, and also to look at differences across stakeholder groups (and all of that is in our report). Overwhelmingly, however, the message from the survey given by all stakeholder groups (whose ratings and rankings are quite similar) is that we have a long way to go on the aid effectiveness front. We might have a pretty good aid program, but the surprisingly low scores for the 17 aid program attributes suggest that we could and should do a lot better.
The 2011 Aid Review’s summary assessment of the aid program was: “improvable but good.” If we had to summarize the assessment of Australia’s aid practitioners and experts, it would be: “good but very improvable.”
This is the real challenge facing the new Government when it comes to aid. On the one hand, it is more than encouraging that the Minister for Foreign Affairs has made a strong personal commitment to progress aid effectiveness. On the other, the perfect storm of the integration of AusAID with DFAT, the budget and staff cuts, and the move away from the strategic aid framework of the previous Government risks undermining effectiveness in the short run, and we are yet to see a new aid effectiveness reform agenda emerge.
Perhaps a repeat of the stakeholder survey in a couple of years’ time will help show us just how much progress there has, or has not, been in tackling Australia’s unfinished aid reform agenda.
Stephen Howes is Director of the Development Policy Centre. Jonathan Pryke is a Research Officer at the Centre.
This is the second in a series of blog posts on the findings of the 2013 Australian aid stakeholder survey. Find the series here.


It is interesting to see how the AusAID people rate their own agency effectiveness. I am wondering if the high turnover (Staff Continuity weakness) has to do with the knowledge in the agency’s inefficiency and lack of effectiveness. I believe the sincerity of the aid staff in desiring to help people have better lives, and I think this survey’s statistic shows that many become disillusioned with the organization. I, too, have become disillusioned at the aid organizations (UNDP, AusAID, USAid, etc).
I first came to Indonesia after the tsunami. On the island of Nias, I helped our faith-based organization build houses for a small community. We stayed with the community while all the other organizations stayed in hotels in the larger city and drove through the countryside in their signed vehicles. The locals called them “drive by helpers.” On a trip to the city to purchase materials, we passed by the UN offices. We stopped in to ask what they were doing about water for the communities throughout the area. The person there was actually an acquaintance and told us the truth that the UN had about $100,000 for the water projects but the man in charge would not give it out unless someone agreed to give him 15%. We called people from our extended organization who cheerfully gave about half that and put shallow wells in 30 communities.
Three years ago I moved here to Indonesia to help academy students learn about themselves and the specific skills they have so that they can be successful in their lives. During that time I have had first hand experience in the education sector corruption. Our school was “given” $18,000 to refurbish several classrooms. We had to use the government supplied contractor who promised that the job would be done in three months. Six months later the job was not finished because they ran out of money. Having been in the construction business for 30 years, I estimated the remodel at $6,000. For the $18,000 we could have purchased 25 computers for a state of the art computer lab as well. I mentioned this to my friend who also has a school where I help,, and she said that she was approached to be “given” $7,500, but she would have to “return” $2,500 to the person who was “giving” it. I told her that I calculated that about 60% of aid money gets to the people who need it and she corrected me and said it is the other way around, only 40% gets to the people. She has been in the business for many years.
I have more stories from the other sectors as well, but my point is that the aid organizations are just avenues for corruption. People are making big money from “helping” others. The survey of people who are making money from the aid institutions is interesting. A better survey for the effectiveness of aid would be to ask people to whom the aid is directed.
The other foreigners that live here have excellent ideas that work and actually help the local people, but they do not have Master’s degrees and many years of experience for ideas that do not work that are required to work for a development organization. They are simple folks who learn and understand the indigenous people and know what works. If they had one-half the budget, they could have twice the effectiveness of the current system.
But, as they say here when I disagree with what the “all knowing” government says, “That is my opinion.”
Stephen
Thanks for this continuing summary for it is a conversation worth keeping alive.
As I presented at the results launch last week, I agree that the findings/perceptions relating to the knowledge burden are most interesting and I offer there are two (at least) opportunities that emerge from this.
First, there has been much commentary about the changes to the aid program and the potential of changes to the staffing base. And survey perceptions talk to issues with turnover and hence a consequent risk of intellectual property loss exacerbating the knowledge burden. So, the data seems very timely and rich to assist DFAT with its planning and change considerations and it is hoped it is considered.
Second, relates to one specific aspect of managing the knowledge burden that you have previously defined – working through effective partnerships. Not all intellectual property of value to the aid program sits in agency. The stakeholders surveyed, and undoubtedly countless others, also have knowledge and value to contribute. The breadth of experiences from the private sector implementing partners remains.
Many such implementing partners are members of IDC Australia. By continuing to explore more effective partnerships with the private sector implementing partners, and with the IDC, at a minimum the perceptions of any risk of IP loss from staffing changes could be mitigated. More strategically, the private sector implementing partners are development professionals, not just contract and project managers, and they bring a lot of learning and experience to better inform practice that is usefully harnessed. Importantly, the private sector implementing partners are not homogenous – individuals and SMEs are critically important in this complex development tapestry and we need to ensure their involvement and contribution is sought and valued.
Mel Dunn
(Chair, IDC Australia)
Mel, thanks for continuing to provide leadership on this point (engaging with the intellectual resources within the private sector) which is one with which I fully agree. Looking forward to talking more on this and other things in February (assuming you will be at the 13th/14th conference)