
Following the Australian government’s cuts to aid earlier this year, a number of public opinion polls showed broad support for these cuts, including polls reported as showing even Greens voters were in favour of cutting aid. We weren’t convinced. And we wanted to see what would happen when people were asked about these cuts in possession of accurate information, while also confronted with policy trade-offs. We also wanted to analyse the disaggregated data in the same way I was able to do with the ANU Poll data I blogged about recently–we wanted to learn the traits associated with support or opposition to the cuts.
So we commissioned our own question in an Essential Media omnibus poll.
The question we asked was:
Every year about 1.2% of Australian federal government spending is spent on foreign aid to poor countries. Recently the government announced that it plans to cut foreign aid by nearly 20% starting in July. They have justified this as a means of preventing government debt rising. Which of the following options would you prefer (each involves equivalent amounts of money)?
- That aid not be cut and government debt levels increase by a small additional amount next year (approximately 0.4%) as a result of this.
- That aid not be cut and taxes be raised by a small amount (approximately 0.3%) to produce the same reduction in government debt sought from the aid cut.
- That aid not be cut and other government expenditure be cut by a small amount (approximately 0.2%) to produce the same reduction in government debt sought from the aid cut.
- That aid be cut by 20% as the government is currently planning.
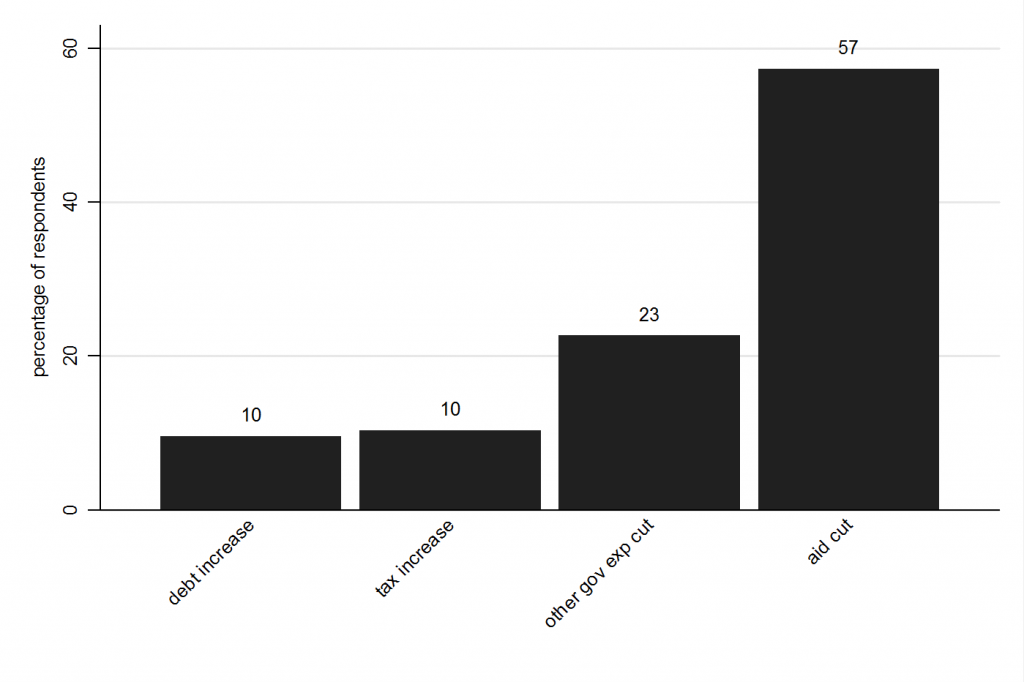
As the chart below shows, the majority of respondents (57% versus 43%; and therefore, by inference, the majority of voting age Australians) supported the cuts.
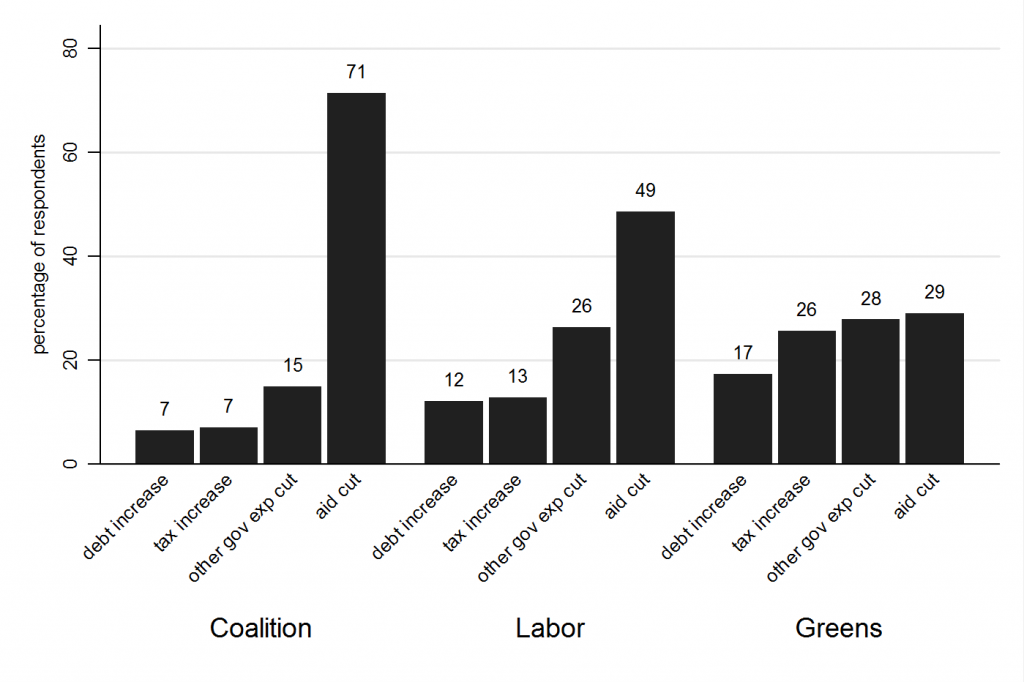
 Support, however, wasn’t universal. The chart below shows support broken down by party. Coalition supporters clearly favoured the cut over alternatives, but 51% of Labor supporters preferred one of the available policy alternatives and 71% of Green supporters preferred an alternative.
 This chart offers a sense of how support for the cut falls across party lines, but because we were given disaggregated data by Essential Media and because these data came with other information about the survey respondents (albeit not nearly as much data as I received from the ANU Poll–there was no information on religion or foreign policy opinions, for example) I was able to use multiple regressions to identify traits associated with opposition to the aid cuts. (To get a sense of the meaning of multiple regression results and how the process untangles the effect of the variable of interest from other variables, read my first post in this series; for in depth results and more detail on methods, see this discussion paper.) To make the analysis less technically complex I grouped support for policy alternatives into one category: ‘opposition to cuts’.
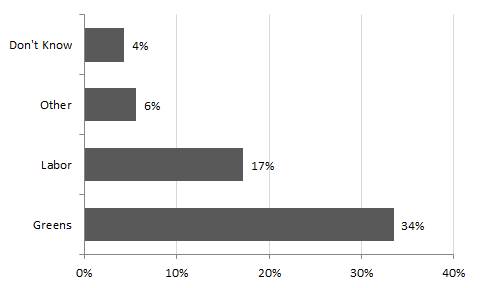
Unsurprisingly, given the magnitude of the difference among supporters of different parties shown in the chart above, even when I controlled for other variables, there was still a strong relationship between party support and opposition to the 2015 aid cuts. The chart below shows that, with other variables controlled for, Labor supporters were 17 percentage points more likely to oppose the cuts than the Coalition supporters, while Greens supporters were 34% more likely.
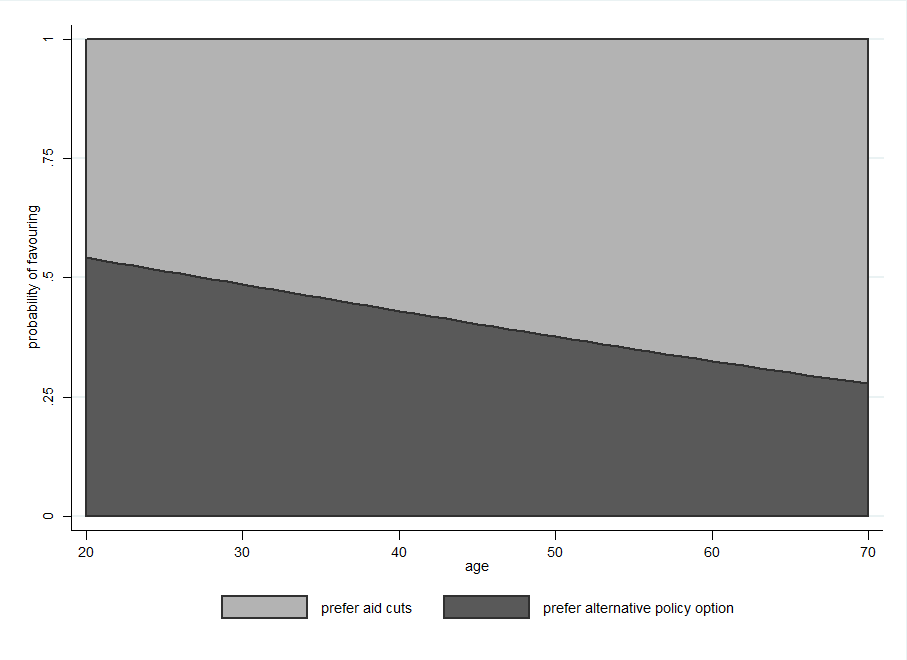
 As with the ANU Poll data, once other variables were controlled for there was no relationship between income and views on the aid cuts, but there was a clear positive relationship between having an academic education and opposition to the cuts. Also, similar to the ANU Poll there was a clear negative relationship between age and opposition to the cuts.
 While these findings were similar to those I found in the ANU Poll, in contrast to my analysis of the ANU Poll data I found no relationship between gender and views about the cuts.
What does all this mean? First, the findings suggest we shouldn’t be quite as pessimistic about public support for the 2015 aid cuts as some surveys would have us believe. And yet, it’s still true that there is an uphill battle to be had on aid volumes. While the ANU Poll findings showed that most Australians are supportive of giving aid, the Essential Media polling still showed a majority of Australians were OK with the 2015 aid cuts.
For people who opposed the cuts and want to see more aid, both polls point to a base for campaigning work–a group of people most likely to be amenable to mobilisation.
Both of the polls suggest this base is primarily amongst younger, better educated Australians, and among people who are politically left-leaning. (While the ANU Poll found a relationship between gender and support for aid, our poll on the cuts didn’t, and given the current campaign fight is about the volume of aid it would be wisest to follow the Essential Media findings.)
Unfortunately, the Essential Media survey didn’t provide data on religion or other foreign policy views but, because most of the findings from the Essential Media analysis were similar to those from the ANU Poll, it seems safe to assume that opposition to aid cuts will also be strongest amongst the non-religious and religious people who attend worship often, and that Australians with an internationalist bent (people more favourable to Indonesia and China, and multilateral organisations) will also be allies.
Finally, the negative relationship in the ANU Poll data between concern with the government’s finance and support for aid emphasises the importance of combating the mistaken belief that aid is anything more than a trivial component of the federal government’s budget woes.
There is still a lot to learn about building an effective campaign against Australian aid cuts, much which can only be learnt from the practical work that campaigners are already undertaking, but public opinion data does provide a good sense of where support for aid, and opposition to cuts, is strongest. We’re conducting ongoing research in this area, and we’ll keep you updated with what we learn.
Terence Wood is a Research Fellow at the Development Policy Centre. His PhD focused on Solomon Islands electoral politics. He used to work for the New Zealand Government Aid Programme. The full discussion paper on which this post is based can be found here, and the first post in this analysis here.

Thank you Terence. As well as looking at the odds of different groups opposing the cuts, have you noticed any differences in results based on how the questions are framed, whether they are part of an omnibus or aid specific survey or whether information about the impacts of aid is provided to respondents?
Thanks Garth,
Good questions: information effects (mostly aid levels but we do want to do stuff on efficacy too) are something we are working on at present, using survey experiments. I will blog more about the results when the data are fully analysed.
On where the data come from — both sets from what were in effect omnibus surveys. I’d be curious to hear why you think this would make a difference, and whether it would be for better or for worse.
Thanks again.
Terence
Given we know that people are not very knowledgable about aid, underestimate its benefits and exaggerate its costs it is not surprising that giving them more information about aid in an interview tends to result in more positive responses (eg http://kff.org/global-health-policy/poll-finding/data-note-americans-views-on-the-u-s-role-in-global-health/ and https://www.youtube.com/watch?v=5NWtAukUPIY). In addition fitting an aid question into an omnibus survey between one on washing powder and one on election preferences is not likely to elicit a thoughtful response or one that they would give when seriously thinking about the human connections and ethics involved in aid. As each survey is different it is hard to compare, but my understanding from reading lots of these surveys is that dedicated aid surveys tend to have more pro-aid results than one-off questions.
Thanks Garth,
The Kaiser link is particularly interesting.
WRT omnibus surveys, it may be the case that “fitting an aid question into an omnibus survey between one on washing powder and one on election preferences is not likely to elicit a thoughtful response or one that they would give when seriously thinking about the human connections and ethics involved in aid”. However, this (thinking about matters other than aid) is actually how the average Australian lives their lives, so my mind is going to provide accurate-enough information, at least with regards to how people currently feel.
cheers
Terence
I agree Terence that the omnibus response has some real world aspects to it. Just suggesting that the form and environment of the question can also be important factors in shaping the response and are worthy subjects of study also.
Thanks Garth,
And I definitely agree that form and environment of the question are important. Indeed, this is (hopefully) something I’m going to try and do some more work on (or at least trying to expose people to more information than can be contained in a simple question, in a form that they might expect to read it).
Terence
Great analysis Terence. Thank you for undertaking this deeper analysis and explanation. This data helps those of us who try to engage in deeper conversations using deeper information within our networks, colleagues and families. Look forward to seeing more short articles using data and analysis of our current economic state and options and what that means for assertions about why we need to cut aid when it is such a tiny portion of our expenditure as a nation. Makes one wonder what would happen if we used a well informed study approach similar to that done by EPAC on attitudes to tax in the early 90s. You may be familiar with the study – I think Glen Withers led that work.
Thanks Elizabeth that’s a very useful suggestion, I will try and find the work.
Terence