Seven patterns and trends in Australian aid
By Development Policy Centre
31 October 2010
 This is the a summary of the first installment of the Aid Open Paper, a series of articles that look at different aspects of scaling up Australian aid. In this first section, we set the scene by considering recent patterns and trends in Australian aid. How much aid does Australia give? Where is it spent? What is it spent on? How does Australia compare to other donors? We hope that you will find this overview interesting and informative. It is not intended to be exhaustive, and we encourage you to share ideas and provide feedback.
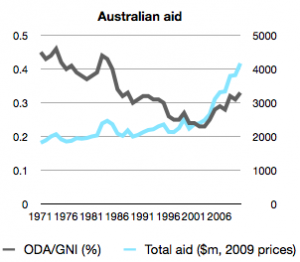
1. Australia’s aid has been expanding rapidly, doubling in the last five years. Australia gave $1.6 billion in 2000-01, $2.2 billion in 2004-05, and $4.3 billion in 2010-11. There is now a bipartisan commitment to increase aid to 0.5% of our gross national income (GNI) by 2015. As long as the mineral boom continues, and our fiscal position stays favourable, there is a good chance that we will reach this target. This means that our aid is set to double again to about $8.6 billion in 2015-16.
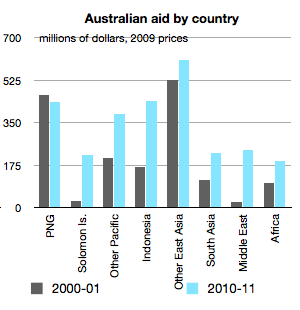
 2. There has been a shift in aid from PNG and East Asia to Solomon Islands, Indonesia, and Iraq and Afghanistan. Aid to every major country and region is up, except for PNG. The biggest increases have been in: aid to the Solomon Islands (due to the RAMSI stabilization intervention), up from from $27 million in 2000-01 to $216 million this year; aid to Indonesia (due to the Tsunami response), up from from $169 million to $440 million over the same period; and aid to Iraq and Afghanistan, for obvious strategic reasons – Middle East aid (which largely goes to these two countries) is up from $26 million to $237 million over the same period. Aid to South Asia and Africa has roughly doubled, but so has the overall aid program, so their share of the program has remained the same.
3. Governance is the biggest spending area for the aid program, though in recent years the biggest increases have been in rural/environment and infrastructure. In the first half of the last decade, increases in aid were targeted at governance. Improving governance is a worthwhile but difficult objective, and by 2005, the “governance first” strategy was starting to run it course. Since 2005, governance spending has been held steady in real terms, and we have seen large increases in funding to education, health, infrastructure and rural/environment. Note though that governance remains the largest area of spending and that even within other sectors a significant proportion is spent on sector-wide governance.
4. The share of aid given to technical assistance is declining, but is still very high. More than half of Australia’s aid used to go to technical assistance (some of it technical training and scholarships, but the bulk on advisers). While this ratio has declined now to around 40-45%, it is still very high compared to other countries. Among OECD donors, Australia is at the top end in terms of reliance on technical assistance, and well above the share of TA in the typical donor’s aid program which is about 20%. The future of technical assistance is clearly one of the big issues for the aid program.
5. Contributions to multilateral donors have not kept pace with aid budget. An important strategic issue for donor countries is how much of it they should give themselves (bilaterally) and how much through international organizations (multilaterally). Measured in terms of core contributions to multilateral organizations, Australia is the most bilateral of all OECD donors. In fact, our contribution to multilateral donors has fallen rapidly as a share of the total aid budget, from 23% in 2000 to 10% in 2008, compared to about 31% in the typical donor’s aid program.
6. AusAID provides 70% of the Australian aid program. In the mid-nineties, the Australian government started using other departments, apart from AusAID, to deliver the aid program. In 2005-06, AusAID’s share of the aid program fell below 50% for the first time. But that trend has now been reversed, and AusAID’s share of the aid program is now higher than at any time over the last decade. How well AusAID performs will be critical to how effectively aid is scaled-up.
 7. Project size has fallen over time. Aid is given through projects. In 1973, the first year for which data is available, Australian aid supported 123 projects. By 1983, this had grown to 211, by 1993 454, by 2003 1,598 and by 2008, the most recent year for which data is available, 2,476. Average project size fell from $20 million in the 1970s, to $10.7 million in the 1980s, $3.6 million in the 1990s and $1.3 million last decade. This tendency towards more, smaller projects is known in the aid industry as ‘fragmentation’. It tends to escalate the administrative and transaction costs associated with aid. These can be especially serious for recipient governments, some of whom run the risk of being overwhelmed by the costs of trying to administer a thinly-spread aid program. If the average aid project size is not increased, then by 2015, we will have some 6,800 projects. That sounds unmanageable, and undesirable, and almost certainly is. Scaling up will have to mean not only more but larger projects.
There is much more that could and needs to be said about recent trends in Australian aid, but the aim of the first section of the Aid Open Paper is to provide a broad introduction and context. More specific issues will be taking up in the coming months as different topics are addressed. We look forward to your comments and feedback as we move forward.
Stephen Howes is Professor of Economics at the Crawford School and the Director of the Development Policy Centre. Matthew Morris is a Research Fellow at the Crawford School and Deputy Director of the Development Policy Centre.
Download the full PDF version of the section of the Aid Open Paper on ‘Patterns and Trends in Australian’ Aid here.
About the author/s
Development Policy Centre

