Australia and the UK: a study in aid contrasts
By Niloofar Rafiei and Stephen Howes
3 July 2013
The UK government’s remarkable decision to increase aid [pdf] in a single year by £2.5 billion has put the spotlight on British aid. The recent proposal by the Australian Greens to emulate the UK’s twin achievements of increasing aid to 0.7 per cent of Gross National Income (GNI) and subjecting it to independent evaluations have further increased the relevance of aid comparisons between the two countries’ aid performances.
It is indeed revealing to compare Australia and the UK not only now but in relation to their aid trajectories since 1970.
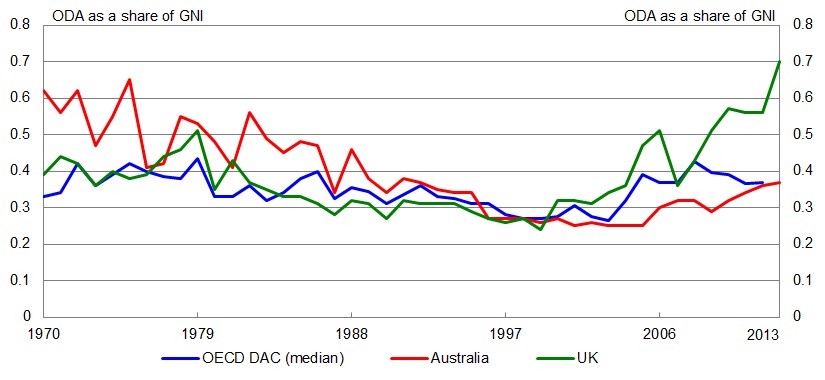
Since the United Nation’s resolution in 1970 to increase aid, or official development assistance (ODA) as it is known, to 0.7 per cent of GNI (Gross National Income), the trajectory of aid spending by OECD countries has been little changed. The blue line in the chart below shows the aid-to-GNI (an aid generosity index) for the typical (or median) OECD country. The line wobbles between 0.3 and 0.4 per cent, but it doesn’t show any steady trend up or down.
Australian and UK aid trends are, by contrast, very distinctive, and very different.
Australian, UK and OECD aid generosity
Source: DFID Statistics on International Development 2012; OECD Development Assistance Committee (DAC) database, Australian Budget 2013-14, UK Budget 2013.
Note: Data for 2013 are forecasts based on respective governments’ budgets. ODA for Australia in 2013 is based on the forecast for the fiscal year 2013-14.
Australia was once an exceptionally generous aid donor. But aid was on a steady downward path from 0.62 per cent in 1970 to just above 0.25 per cent in the early years of the last decade. All that the much-vaunted doubling of aid since 2005 has done has been to restore Australian aid to the DAC norm. In 2013-14, our aid is expected to reach 0.37 per cent of GNI – equal to what the median DAC donor gave in 2012.
The UK, by contrast, has gone in a different direction. For some 30 years, it was a pretty average DAC donor with an ODA/GNI share of around 0.3 to 0.4 per cent. Last decade that ratio started increasing to reach 0.47 per cent in 2005, and 0.7 per cent in 2013.
In summary, Australia has gone from being an extraordinary donor to an ordinary one, and the UK has made the opposite journey.
Why? In the early days of Australia’s aid program, our aid went overwhelmingly to PNG. But we capped that in nominal terms, and increased total aid only more or less at the rate of inflation until the last decade.
The UK’s earlier indifferent aid performance is surprising given its colonial history. Its recent aid rise is largely explicable in terms of the success of a massive and sustained NGO campaign. Call it the Geldof legacy. It is a spirit of generosity that has infected both sides of politics in the UK, where the commitment to aid remains bipartisan, notwithstanding a recession and some hostile tabloid attacks.
It’s an interesting comparison, one which speaks to the relative decline of Australia’s aid program over time. The good news is that the long fall in our aid relative to the size of the economy has halted. The bad news is that we’ve only become an ordinary donor.
Niloofar Rafiei is a Research Associate with the Development Policy Centre, based in London. Stephen Howes is Director of the Centre.
About the author/s
Niloofar Rafiei
Niloofar Rafiei is a Research Associate with the Development Policy Centre, based in London.
Stephen Howes
Stephen Howes is Director of the Development Policy Centre and Professor of Economics at the Crawford School of Public Policy at The Australian National University.
