Australia’s 2013-14 aid budget: the macroeconomic context
By Anthony Swan
15 May 2013
While there are many questions that surround the 2013-14 aid budget, I will focus on the macroeconomic context that has framed the budget, including a short analysis of the underlying drivers of the Government’s fiscal position, how the aid budget has fared relative to other expenditure programs, and the main risks to the aid budget over the forward estimates period (up until 2016-17). This blog piece is based on material that I presented at the Development Policy Centre’s aid budget forum on May 15 (my powerpoint slides are available here [pdf]. Videos of the presentations at the forum will be available shortly).
The Treasurer announced on Tuesday May 14 a budget deficit of over $19 billion for 2012-13, a turnaround of $21 billion compared to the last budget, to be followed by two more years of deficit before small surpluses in 2015-16 and 2016-17. The recovery from budget deficits is projected to take three more years than previously expected. If you listen to budget commentary there is a lot of doom and gloom about the Government’s fiscal position, particularly related to revenue. I have a slightly more optimistic perspective of the macro context, particularly for the Australian aid program, although there are significant downside risks to be aware of.
Movements in total revenue and expenditure as a share of GDP (Fig. 1) provide a good summary of the government’s fiscal position. A declining revenue share was a feature in the first half of the last decade but was matched by tight spending controls. Revenue dramatically increased with the resource boom and was quickly followed by high spending during the period prior to the end of the last Coalition Government. Revenue quickly fell away as the GFC took hold but the Government’s stimulus package ensured that expenditure remained high. From this year to 2017, revenue is expected to recover and spending to be reined in.
Figure 1: Total revenue and expenditure as a share of GDP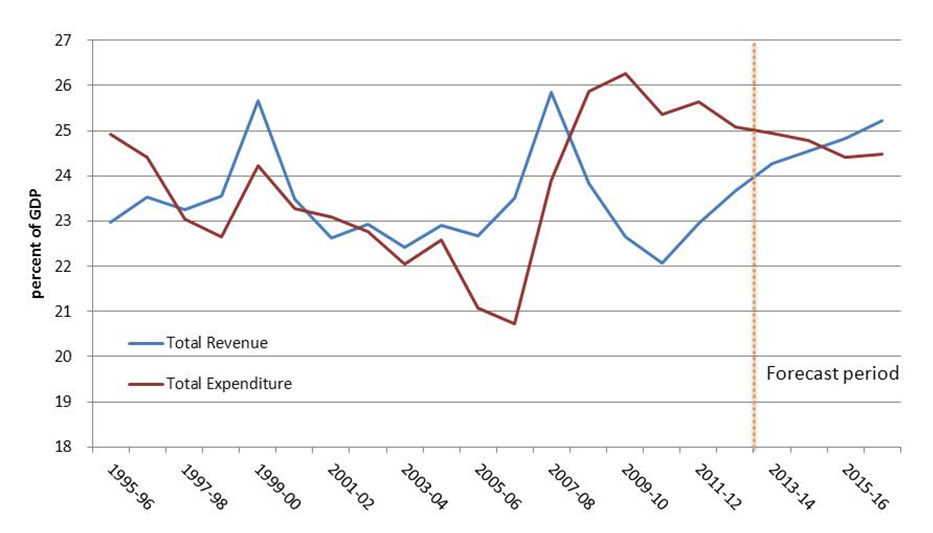 Source: Budget 2013-14 documents.
The so called “black hole” surrounding government revenue is reflected in Fig. 2. However, despite the rhetoric by the Government, there is no fall in projected revenue or even a blip – it is only a fall relative to expectations in previous budgets. Lower levels of company tax and resource rent taxes (around $23 and $19 billion over the four years from 2012-13, respectively) are the greatest contributors to the lower revenue expectations. These lower expectations reflect a terms of trade that has eased off only around 10% in the last two years as well as lower economic growth assumptions (3.25% nominal growth for 2012-13 in this year’s budget vs 5% in the previous budget).
Figure 2: Total revenue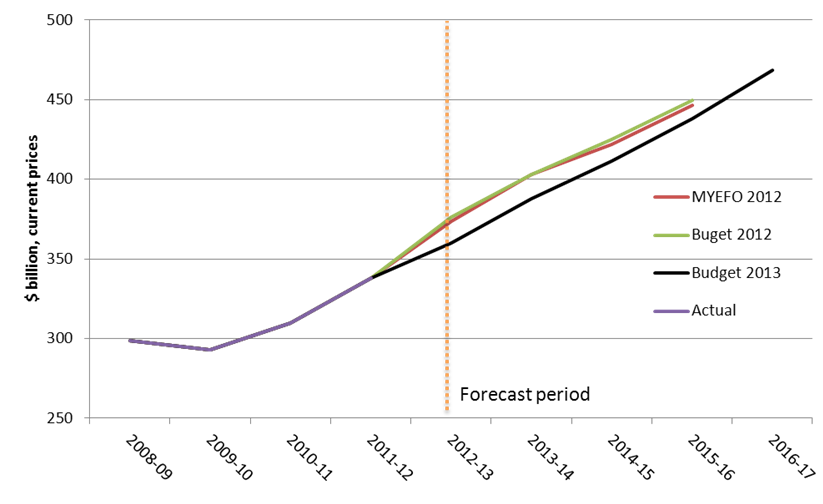 Source: Budget 2013-14 documents.
The Government announced around $18 billion in savings to expenditure in an effort to minimise the size of the projected budget deficits. However, projected total expenditure contained in the 2013-14 budget is largely unchanged relative to projections in previous budgets. New spending has essentially offset these savings.
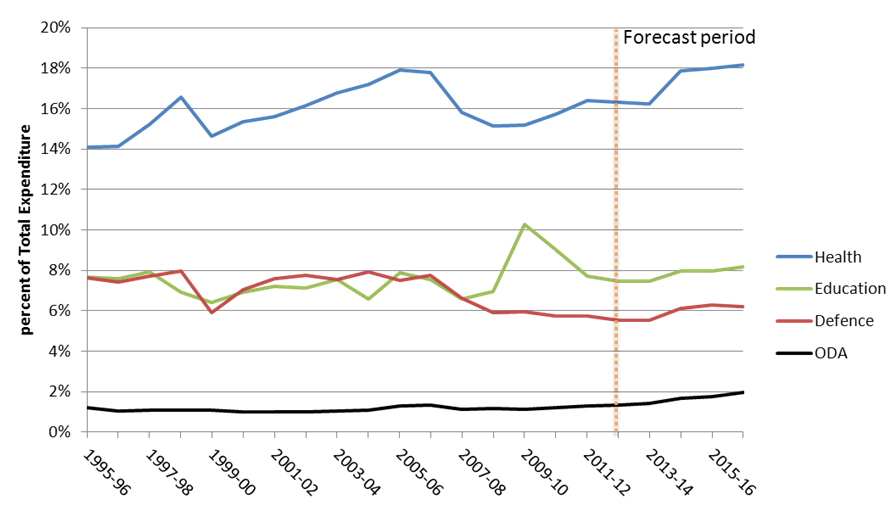
In this context the aid budget has fared well compared to other spending areas. Figure 3 shows that Official Development Assistance (ODA) spending, although relatively small, has increased as a share of total expenditure. Year on year growth in ODA spending is projected to be at double digit levels over the forward estimates period. In contrast, government spending in each of the health, education and defence sectors is expected to grow at around 5% per year.
Figure 3: Sector shares of total expenditure
Source: Budget 2013-14 documents.
A useful benchmark to evaluate the size of the aid budget is to compare ODA spending as a share of GNI (target of 0.5%) to defence spending as a share of GDP (target of 2%), noting that GNI is only around 3% higher than GDP. Figure 4 shows that the defence spending share has fallen from near 2% in 1995 to 1.4% this year, with this level being maintained over the following four years. In contrast, the ODA spending share has increased almost every year since 2000 from 0.24% to 0.35% this year, with further increases factored in to take the share to 0.5% of GNI by 2017.
Figure 4: Defence vs. ODA spending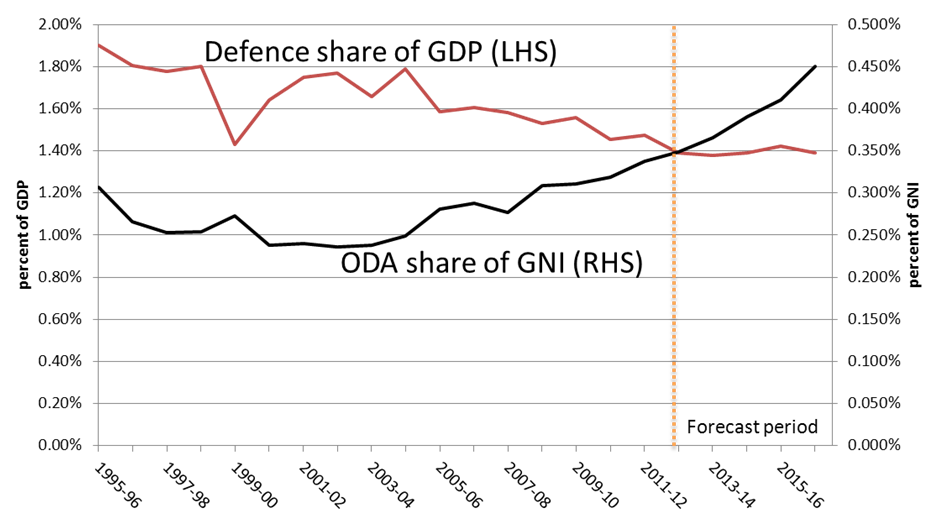 Source: Budget 2013-14 documents.
Overall, the 2013-14 budget has been favourable to ODA spending in the context of current macroeconomic conditions. However, the most difficult task for the government as it strives to bring future budgets into surplus will be to keep tight controls on total expenditure. Failure of the government to control overall spending represents a significant risk to the aid budget in terms of further delays to achieving the 0.5% target or removal of the target completely.
This post is part of our series of analysis of the 2013-14 Australian aid budget. The rest of the series can be found here.
Anthony Swan is a Research Fellow at the Development Policy Centre.
About the author/s
