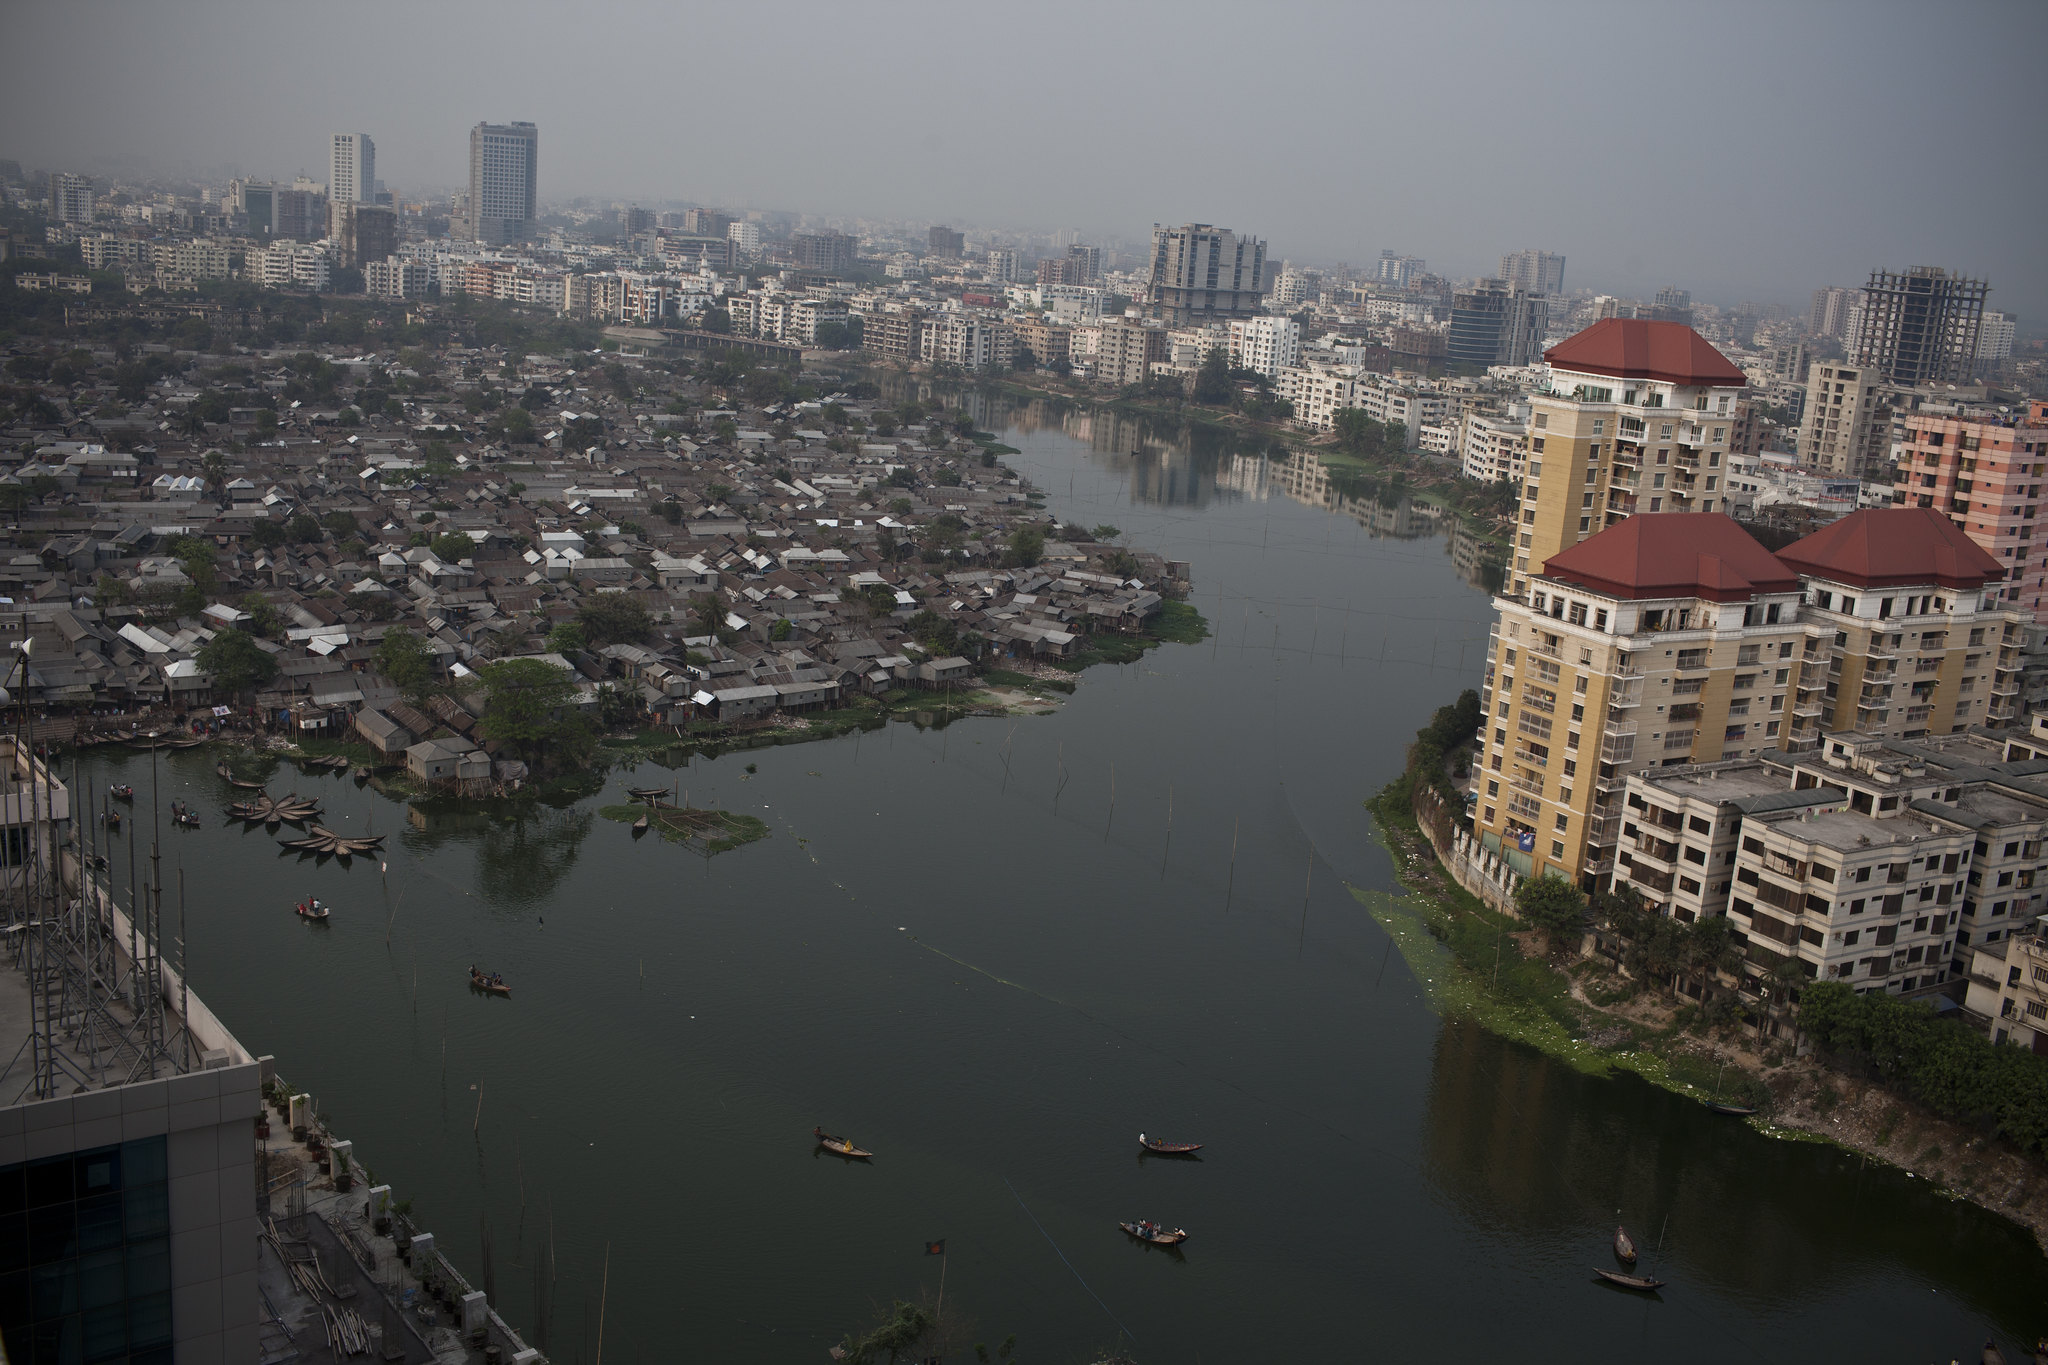
Dhaka, Bangladesh
Fewer adjectives, more focus on economic growth for development
By Lant Pritchett
28 July 2022
Increasingly, adjectives about growth – modifiers about growth’s inclusivity (‘pro-poor’, ‘equalising’, etc.) and sustainability (‘green’, ‘carbon reducing’, ‘environmentally friendly’, etc.) – have dominated conversations among development actors. While the intentions behind this shift are well meaning, without sustained and rapid economic growth, no amount of concern for inclusivity or sustainability will secure the resources required for achieving large improvements in human wellbeing, including those outcomes that promote this focus in the first place.
The following figures do not so much demonstrate as illustrate (literally) this claim (the demonstration is in the papers from which the figures are taken). They lay out facts about growth and its association with outcomes that should be kept front of mind in debates about the priorities for development.
Figure 1 displays historical GDP per capita of the world’s three leading economies of the time, going back to the 1870s. In the mid-19th century, growth accelerated rapidly relative to previous history, with the GDP per capita of the leading countries doubling from roughly US$4,000 to US$8,000 between the years 1850 and 1950. Jumping forward several decades, in 2018 the USA, Norway and Switzerland average GDP per capita is US$67,000. The GDP per capita of typical (median) lower-middle income countries, such as India and Vietnam, in 2018, is that of the leading countries (UK, USA and the Netherlands) in 1900. The comparison is even more dramatic when looking at the poorest countries in the world – Ethiopia, Democratic Republic of Congo and Niger – which currently sit at levels of GDP that are lower than those of Egypt during the Roman Empire more than 2,000 years ago.
Figure 1: The median developing country has the GDP per capita the leading economies had in 1900 – and a quarter of developing countries have GDP per capita lower than the leading countries in 1950
Vertical axis shows GDP per capita (GDPPC) using purchasing power parities (PPP), based on the ‘Maddison update’ database. See Pritchett (2022) for more information.
The second figure shows the (non-linear) association of levels of poverty (at three different, widely used, poverty lines) alongside the median level of the consumption distribution from which the poverty rate is calculated. This demonstrates a not just strong relationship, but nearly complete association between high (or rising) median individual/household income and falling overall poverty rate. This graph shows empirically that a high income for the typical person in an economy is a necessary (no country has low poverty without high median income) and sufficient (no country has high poverty with high median incomes) condition for low poverty.
Figure 2: Median income/consumption of a country completely predicts the level of poverty
Data is from the World Bank’s PovCalNet for the three different poverty lines shown. The trend lines are fitted using a functional form with powers from -2 to +5. See Pritchett (2019) for more information.
The third graph focuses on ‘basics’ – those indicators even within sectoral indicators that are more basic – child mortality within all health indicators, for example, or access to sanitation within all infrastructure indicators. Figure 3 compares a generic index of a country’s achievement on basics to GDP per capita. In addition to showing, as the other graphs do, that the relationship is tight, this also shows that the relationship is highly non-linear. Starting at low levels of GDP per capita, progress on basics is steep, then tapers off to near zero at around US$40,000 GDP per capita.
Figure 3: GDP per capita and the basics of human wellbeing

The horizontal axis shows GDP per capita (GDPPC, divided by 1000) from the Penn World Tables 10.0 for the year 2018. The vertical axis shows the Basic Human Needs component of the Social Progress Index, which measures progress against nutrition and basic medical care, water and sanitation, shelter and personal safety. See Pritchett and Lewis (2022) for more information.
This graph demonstrates the importance of separating discussions on the priority of growth in rich industrial countries compared to developing countries. In already prosperous countries, such as the US, UK or Australia, additional GDP growth is unlikely to make a significant difference to the basics of human wellbeing. However, in most developing countries the story is quite different. Every country in the bottom 20% of GDP per capita has very low levels of basic development outcomes. The very important implication of this graph is that “preferences don’t determine priorities”.
It would be perfectly natural for a lower-middle income country to be highly focused on rapid and sustained economic growth in order to provide the material basis for achieving high levels of the basics of human wellbeing. And, by the same token, countries at very high levels of GDP per capita, for example New Zealand, might decide that there are other higher priorities for wellbeing than economic growth and that they already have the high levels of economic productivity and material conditions to solve their problems. But, what would be a massive mistake would be for people in New Zealand (or any other high-income country) to conclude that since their priority was not on economic growth, other countries in radically different material conditions and with radically different levels of the basics should not prioritise economic growth.
Back to the theme of adjectives, the point of these graphs is that one didn’t need any modifiers about median income or about national development or about GDP per capita to show a very, very strong relationship with economic growth. If only one kind of growth were strongly associated with poverty or wellbeing, then growth measured without accounting for that specific kind of growth would show a weaker relationship. As an analogy, if only brown horses could pull a plough and brown horses were just one of many colours of horses – black, white, grey, spotted – then the relationship between brown horses and ploughs pulled would be tight, and between just horses without colour specified would be weak. But so far is seems it is ‘growth’ that matters most, not its adjectives.
The trend in the development sector towards a microfocus on the efficacy of individual programs misses the elephant in the room – the dominant empirical importance of economic growth specifically and national development more generally. As I like to explain to my adjective-prone students when they argue the need to focus on ‘inclusive’ or ‘sustainable’ growth priorities in the pursuit of development, a purple unicorn and a polka dot unicorn are ontologically the same – and neither can pull a cart. Inclusive non-growth is not at all close to inclusive growth – the noun matters more than the modifiers. And inclusive non-growth is much worse for improving wellbeing than non-inclusive growth.
The focus on the type of growth (or what can be done programmatically to raise wellbeing in the absence of growth) has led the discussion away from the key issue and topic. The pursuit of economic growth must be recentred as the key priority of developing countries, along with donor agencies and other well-meaning actors in the international development sector.
This blog is based on a presentation given at the 2022 AAC Speaker Series, a monthly online event co-hosted by the Development Policy Centre and The Asia Foundation. For more information on the figures above, read this longer blog, view the presentation or watch Lant Pritchett present ‘Growth, a graphic exposition’.
The author thanks Miranda Lucas for her assistance with this blog.
About the author/s
Lant Pritchett
Lant Pritchett is Research Director of the Research on Improving Systems of Education (RISE) program; and Fellow at the Blavatnik School of Government, University of Oxford.
