NGO donations: are Australians turning inwards?
By Terence Wood
26 March 2020
Donations to Australian international development NGOs fell from 2015 to 2018 (the most recent year with data). I’ve argued in earlier blogs that some of the fall came from tougher economic times. However, Australians might also have given less to development organisations because they were giving more to other groups, particularly civil society organisations that work domestically. Perhaps the fall was driven by Australians turning inwards?
Normally, when I study donations to development NGOs, I use data from the Australian Council for International Development (ACFID). ACFID’s data are carefully curated and easy to work with, but they only focus on development NGOs. I needed another source if I wanted to compare international development NGOs with other organisations. For this, I had to use donations data from the Australian Charities and Not-For-Profits Commission (ACNC).
ACNC data are amazing, but they’re not easy to use. This isn’t the fault of the ACNC, who do a remarkable job of gathering data and putting it in the public domain. But civil society isn’t a tidy place: the neat categories that would allow easy analysis on paper don’t exist in reality. And, like academics, people working in civil society organisations aren’t always good at filling out forms accurately, or consistently.
You can read about the challenges this caused in this PDF, but you can also spare yourself the suffering, skip it, and simply beware: the numbers in this blog aren’t perfectly accurate. Short of me doing another PhD devoted to tidying and categorising data, the numbers couldn’t be perfectly accurate. Rather, they are useful approximations – accurate enough to give us a sense of what’s going on.
You do need to know about the terms I use in this blog though. ‘Development NGOs’ means what you’d expect: Australian organisations, or international NGOs with an Australian chapter, that work to improve material well-being and promote rights in less affluent countries. ‘Domestic and other CSOs’ includes most other Australian civil society organisations (CSOs) registered with the ACNC. The group includes organisations doing very similar work to development NGOs but focused on helping Australians. It also includes many religious entities, which may work overseas, but primarily focus on spiritual matters when they do. And it includes some non-state, not-for-profit schools and hospitals. It’s a messy group. But don’t worry, I’ll break it down later in the blog. There were a small number of organisations which belonged in both International and Domestic. I coded them as Domestic. This will have had only a very minor impact on the findings below.
Also, the domestic and other CSOs group isn’t the absolute sum total of Australia’s non-development Civil Society. Donation data from the ACNC also exclude a subset of religious organisations defined as “Basic Religious Charities”. These organisations don’t have to report donations to the ACNC. Fortunately for my analysis, donation flows to Basic Religious Charities are probably fairly small and won’t affect findings much.
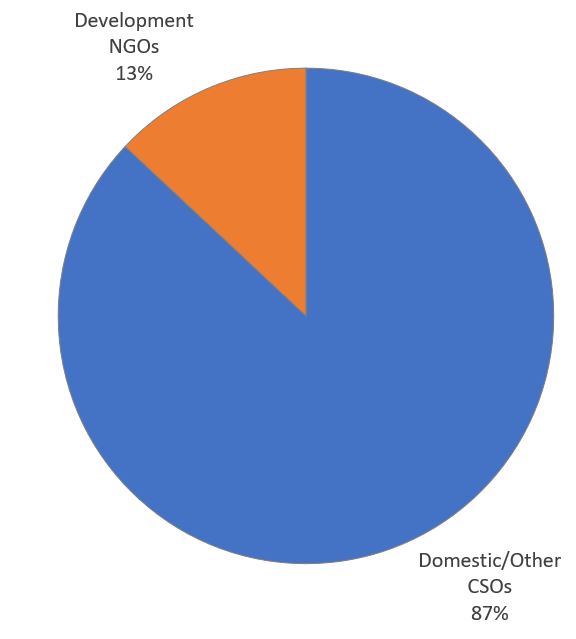
In terms of findings, let’s start with a sense of proportion. Figure 1 shows the share of donations going to development NGOs and the share going to domestic/other CSOs. Data are from 2015, the recent peak of development NGO donations. If we were to choose a more recent year, the slices of the pie would change a bit, but not much.
Figure 1: Share of donations to Australian development NGOs and other CSOs, 2015
The majority of donations went to domestic/other CSOs, but development NGOs still got a good chunk. The Australian Government devotes less than 1 per cent of federal spending to aid. When the Australian public reach into their wallets to help others, more than 10 per cent of what they give goes to international development.
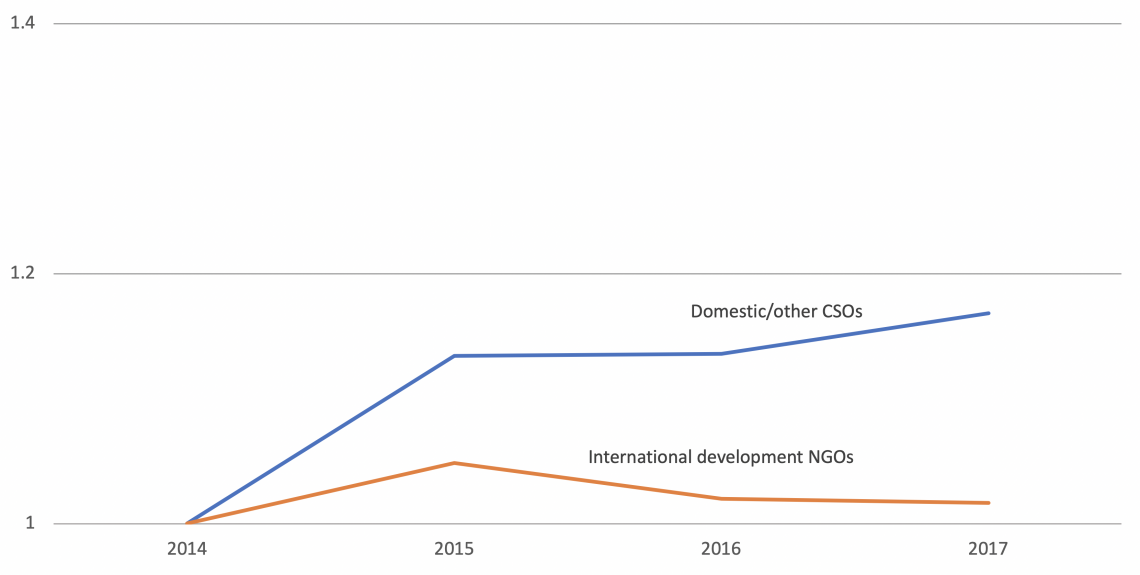
Looking at trends, available ACNC data span from 2014 to 2017. Figure 2 shows donations to development NGOs and domestic/other CSOs as a ratio of donations in 2014. I have not adjusted the data in this figure for inflation. The time series is short, and the main point is comparing the trajectories of the two lines – both are affected equally by inflation.
Figure 2: Change in donation revenue, 2014–17
The obvious point in the figure is that domestic/other CSOs haven’t fared as bad post-2015 as development NGOs have. But – and this is a crucial point – the pattern is not what we’d expect if the two groups were in strict competition. 2014–15 was a good period for both, 2015–16 was not nearly as good for either, each group found 2016–17 a bit better. The fortunes of one group do not wax as the other group’s wane; they move in a tandem of sorts. It’s just that domestic/other CSOs have more robust support than development NGOs. (You can download the large datafile that these first two figures come from here; it affords you the ability to modify my approach somewhat too.)
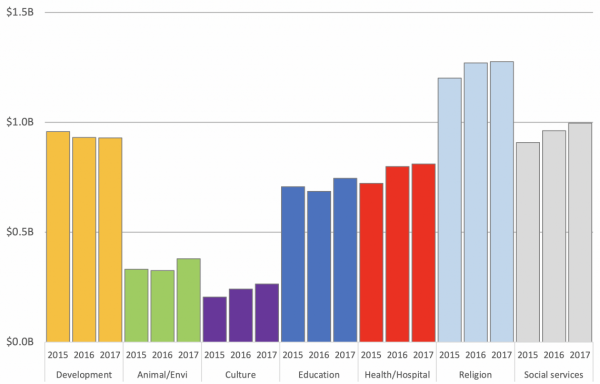
Thus far I’ve been talking about a combined domestic/other CSO group. But what about its constituent parts? As I said, it’s a very diverse group. Figure 3 is based on a different spreadsheet (huge download) using ACNC data again, but limited to three years. In this, I’ve done my best to categorise organisations based on their purpose. International development NGOs are in the first group. All the other groups are populated by organisations with a heavy focus on domestic work, except the religious category. (The religious category are still two-thirds domestic; their international work is not normally development related.) I’ve excluded some groups from the figure for legibility’s sake, but the big groups are included. In the data difficulties PDF you can read about the challenges of categorising CSOs. Once again, what you’re looking at is an approximation. It’s worth noting that many organisations in the ‘Education’ group are schools and universities, and these organisations are driving the change in this group. Also a large minority of organisations in the ‘Health’ category are hospitals, but they’re not driving the change in their group.
The most obvious point from the figure is that every other category is going up. This includes ‘Social services’, which is probably the best domestic analogue of development NGOs.
I think it’s wrong to say that over the years 2015 to 2018 greater domestic giving came at the expense of international NGOs. Nevertheless, it seems clear from the data that domestically focused organisations were able to keep donations growing over a period when development NGOs struggled.
Obviously, the data I used all came from before the bush fires. It’s likely that Australians’ desire to help at home during such a dramatic and traumatic event will have reduced donations to development NGOs. Also, when I conducted the analysis for this post, and wrote the first version, COVID-19 had yet to make the news. If the Australian Government’s ability to respond is found wanting, donations to development NGOs will likely fall, as domestic giving responds to local need. More broadly, even if the government helps adequately domestically, lean economic times appear inevitable. And in lean times donations to development NGOs are likely to fall more rapidly than donations to their domestic counterparts. The message from trends between 2015 and 2018 is that domestic organisations have more robust support than development NGOs do.
About the author/s
Terence Wood
Terence Wood is a Fellow at the Development Policy Centre. His research focuses on political governance in Western Melanesia, and Australian and New Zealand aid.

