Papua New Guinea: an assessment of trade performance
By Sabit Otor
6 November 2014
In this post, I analyse four trade performance indicators for PNG over the last two decades: growth in real exports; share of world exports; the openness of the economy and; export diversification.
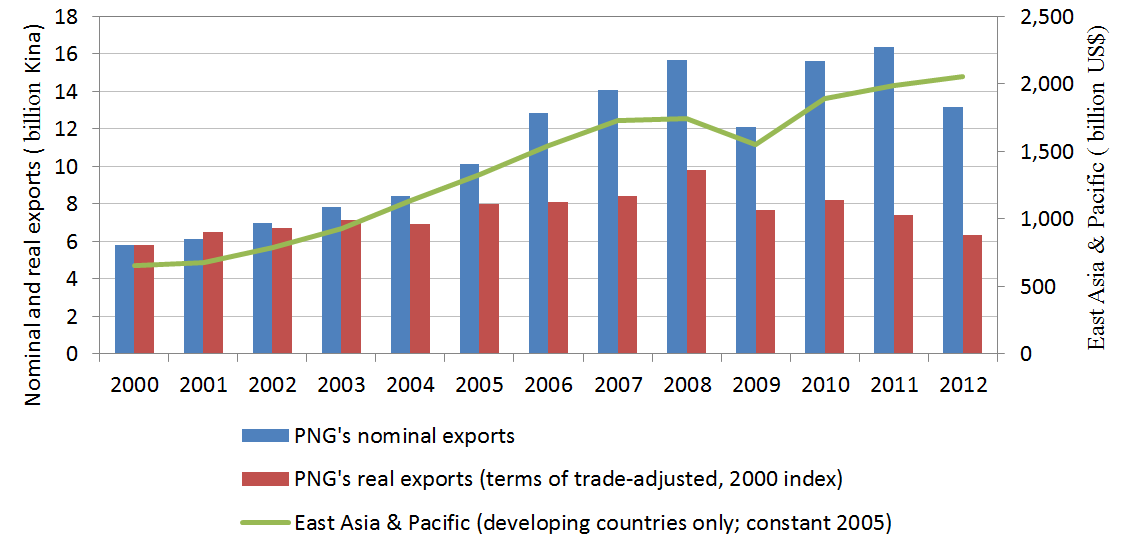
Figure 1 shows PNG’s export revenue (in current prices) for the last two decades. Despite some short-term fluctuations, there has been a huge increase in export revenue, with an annual average increase of 9.0%. In these terms, PNG has done impressively. However, nominal revenues are driven by international prices and do not necessarily reflect the exporting capacity of a country. To get around this, we can deflate these nominal values by inflation. This is our first indicator of trade performance, PNG’s real export values (CPI-adjusted, 2005 Kina). Now the picture is not nearly as impressive as in nominal terms. The annual average change between 1993 and 2008 is 3.8%. Exports in both nominal and real terms experienced a decrease during the period 2008-12. Over the long-term (for the entire period 1993-2012), PNG’s real exports have grown in real terms by just 0.8% a year. (See similar analysis here [pdf]from the 2014 PNG Update by UPNG researchers (p.24).)
It is worth reflecting on PNG’s real export performance as compared to the developing countries of East Asia and the Pacific as a group: during the period 1993-2012, the group’s real exports (measured at constant 2005 US$) increased by 11.5% a year, an extraordinary rate.
Figure 1: PNG exports
 Source: Nominal exports and consumer price index series from Bank of PNG; East Asia & Pacific data from WDI database. Note: Nominal exports were converted to real exports using the consumer price index (author’s calculations).
Similar results are obtained if exports are deflated by the terms of trade index. This figure is shown at the bottom of the post and reveals that exports in 2012 are similar to those in 2000 once they are deflated in this way.
The second indicator is PNG’s share of the total world exports. Since 1993, PNG has been losing its export market share to competing countries in the global market. Figure 2 shows that there has been a significant decrease in PNG’s merchandise exports share in the world market over the last two decades: the share decreased from 0.07% in 1993 to 0.03% in 2012. (Oceania’s aggregate share decreased from 0.12% to 0.05% in this period.) By contrast, over this period, the developing countries’ share of global merchandise exports increased from 27.3% to 44.8%.
Figure 2: World exports
 Source: From UNCTAD Statistics, author’s calculations.
The third indicator of trade performance is trade openness. This indicator is measured by the average of total exports and imports divided by GDP (the average trade-to-GDP ratio). This indicator reflects the importance of the trade to the domestic economy and the economy’s integration in the world economy. Figure 3 shows the pattern of changes in the ratio for PNG, developing Oceania and developing countries over the period 1993-2012. PNG’s ratio has always been high. PNG’s average trade-to-GDP ratio increased from 48.7% in 1993 to 76.3% in 2007 (its peak). However, since 2007, this ratio has declined, and it was 46.8% in 2012 (the lowest in the entire period). The massive drop during the period 2008-09 is largely due the global financial crisis, which severely affected international trade and thus both global demand for and the prices of PNG’s commodities. Therefore, when taking a long-term view (from 1993 to 2012) PNG’s ratio has decreased. By contrast, there has been an increase in the average trade-to-GDP for the both developing Oceania and developing countries: over the period 1993-2012, these ratios increased from 35.9% to 40.9% (for developing Oceania) and from 26.4% to 35.9% (for developing countries).
Figure 3: Average of total imports and exports as a percentage of GDP
 Source: From UNCTAD Statistics, author’s calculations.
There are advantages of opening up the domestic economy to the world but also risks, particularly when a country’s export portfolio is concentrated in a few products. A sudden collapse in these product prices and/or fall in their demand could weaken the domestic economy. The fourth and final indicator used in here to measure PNG’s trade performance is a concentration index. The indicator measures the extent to which a country’s exports are concentrated in a small number of products. The index is calculated by summing squares of the percentages of the partner’s share of total world exports. The indicator ranges between 0 and 1: with the index closer to zero indicating a more diversified export portfolio and the index closer to one indicating a more concentrated export portfolio.
Figure 4 shows the concentration indices for PNG, developing Oceania and developing countries over the period 1995-2012. PNG has a high and relatively stable concentration index, implying that its export portfolio remains concentrated. As this analysis [pdf] shows–despite some growth of non-mineral exports to Asia (mainly logs)–sales of gold, copper and oil contribute roughly two third of total exports earnings to PNG.
Figure 4: Concentration index
 Source: From UNCTAD Statistics, author’s calculations. The index shown is the Herfindahl-Hirschman concentration index.
The preceding analysis indicates the need to remedy PNG’s trade performance. Adjusting for inflation, it shows very slow trade growth, and PNG has been losing global market share. Of course, PNG’s performance will get a boost from LNG exports, which have commenced this year. But one project does not make an economy, no matter how large. A diversified, dynamic export sector is critical for the sustained growth of the PNG economy.
Sabit Amum Otor is an ANU graduate and Research Associate at the Development Policy Centre.
Additional graph: Calculating real exports using PNG’s terms of trade price index
About the author/s
Sabit Otor
Sabit Otor is an Associate at the Development Policy Centre. His research focuses on aid effectiveness, aid for trade, macroeconomic determinants of aid graduation, and developing countries. He holds a Bachelor Degree of Science and Education from Alexandria University (Egypt), a Bachelor Degree and Graduate Diploma of Economics from ANU and a Master of International and Development Economics from ANU.
