The perils of quantifying corruption
By Tatia Currie and Stephen Howes
29 September 2016
Transparency International (TI) PNG’s recent report, Public Opinion Survey in Five Provinces on Levels and Consequences of Corruption in Papua New Guinea and State and Society Response, 2015 [pdf] indicates that corruption is alive and well in PNG.
It is based on interviews with 1,280 respondents across five provinces. Multi-strata sampling was used, with a 50-50 urban/rural and gender split, and proportional representation of different adult age groups aged 18 and over. Only villages within a 50 km range of major cities were sampled, so more remote areas were omitted.
The results suggest a consensus among respondents that corruption is a big or very big problem in PNG (99%), that levels of corruption are higher or much higher than in other countries (80%), and that it’s getting worse or much worse (90%). Most respondents think government efforts to stamp out corruption are not genuine or only partly genuine (77%).
This report follows a previous (2010-2011) survey [pdf] conducted by TI PNG, which interviewed 1,800 respondents across nine provinces and provides an understanding of what Papua New Guineans think about corruption and anti-corruption efforts.
The latest report does provide new insights into the extent of everyday nature of corruption in PNG. Close to half the respondents surveyed (46%), said that they had paid a bribe in the last year as a means to accessing a supposedly free service.
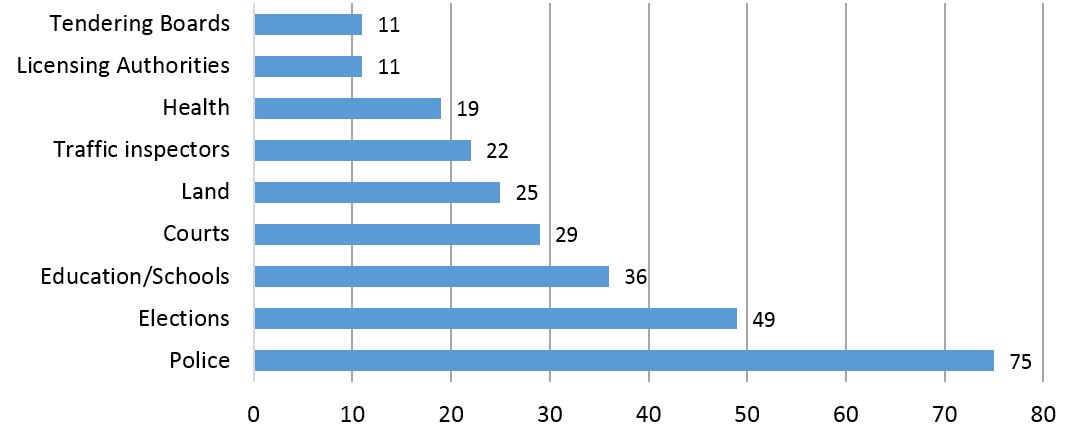
Figure 1 below shows that most respondents (75%) perceive the police as the government sector to have the worst level of corruption, with bribery the most prominent type of corruption (58% of all instances of police corruption) followed by misappropriation (30%).
Figure 1: Government sectors perceived to have the worst levels of corruption (N=1280)
Note: Respondents were asked to rate the three worst sectors, so the proportions shown here will not add up to 100.
Corruption is common, but how big is it? In theory, we should be able to calculate this from the data provided in one of the report’s tables, Table 1 below.
Table 1: Cross analysis of value of bribes paid annually by frequency of giving bribe
*Note: As the TI report notes, “This percentage seems astonishingly high and may be an error. However, given that it is only [30% of] 5% of the total it is not significant.”
With PNG’s total population in 2015 estimated at 7.6 million, total population above 18 years 4.1 million (54%), and 46% reporting that they paid a bribe, the figures in Table 1 suggest aggregate annual bribes paid of K9 billion, or K2,000 per adult, almost 20 per cent of GDP. This is simply impossible. (Recall, this is just payments by the public; it doesn’t include siphoning off of public funds.) A survey of India suggested average bribes of a tenth of this amount in that country.
Note from Table 1 that 25% say that they pay a bribe once a week or more. This itself seems implausible. Citizens surely do not interact with the government enough for this to be the case. What is going on? Perhaps respondents didn’t understand the question, or perhaps they wanted to indicate their outrage. In either case, this simple calculation suggests that we should be wary of quantitative responses to corruption surveys of the public. Corruption might be bad in PNG but it is surely not that big.
Tatia Curie is an Associate Lecturer in the Division of Public Policy, School of Business and Public Policy, UPNG, and Stephen Howes is the Director of the Development Policy Centre.
Note: We conservatively assume those who report bribes ‘once a week or more’ pay bribes once a week; ‘once or twice a month’, once a month; ‘once or twice a year’, once a year; and ‘don’t know’, never. We also assume that those who report paying less than 20 Kina pay 10 Kina on average; 21-50, 35; 51-100, 75; 101-500, 300; 501-2000, 1250; more than 2,000, 2,000; and don’t know, zero. The sample is not weighted, but bribes seem common across all groups, so proper weighting would not make much difference, though inclusion of more remote areas would presumably push the national averages and totals down.
About the author/s
Tatia Currie
Tatia Currie is an Associate Lecturer, working in Port Moresby as part of the partnership between the ANU Crawford School of Public Policy and UPNG School of Business and Public Policy. She has experience in both teaching and applied policy contexts in Africa and Australia and a Masters in Public Policy from the University of Tasmania. Her policy interests include policy design and policy entrepreneurship, governance and policy transfer.
Stephen Howes
Stephen Howes is Director of the Development Policy Centre and Professor of Economics at the Crawford School of Public Policy at The Australian National University.


