The PNG economy is heavily reliant on the production of resource and agricultural commodities. Because these commodities are exported, they are well measured. As the figure below shows, the value of commodity exports to GDP increased from about 25 per cent at the time of independence to almost 50 per cent at the height of the resource boom, and, after falling to as low as 25 per cent just before PNG LNG production began, recovered to almost 45 per cent by 2019, before falling again in 2020.
Data notes on commodities
Adjusted by CPI, commodity exports have grown on average by 3.7 per cent between 1977 and 2019. This overall fairly rapid growth masks a radical shift in the composition of commodity exports, shown in Figure 5.10 of this joint ANU-UPNG paper. At the time of independence, about half of commodities exported by value were agricultural. Now they are 10 per cent (including marine products). Timber and marine exports have both grown to about 4 per cent of the total. Resource exports have grown from half to over 80 per cent.
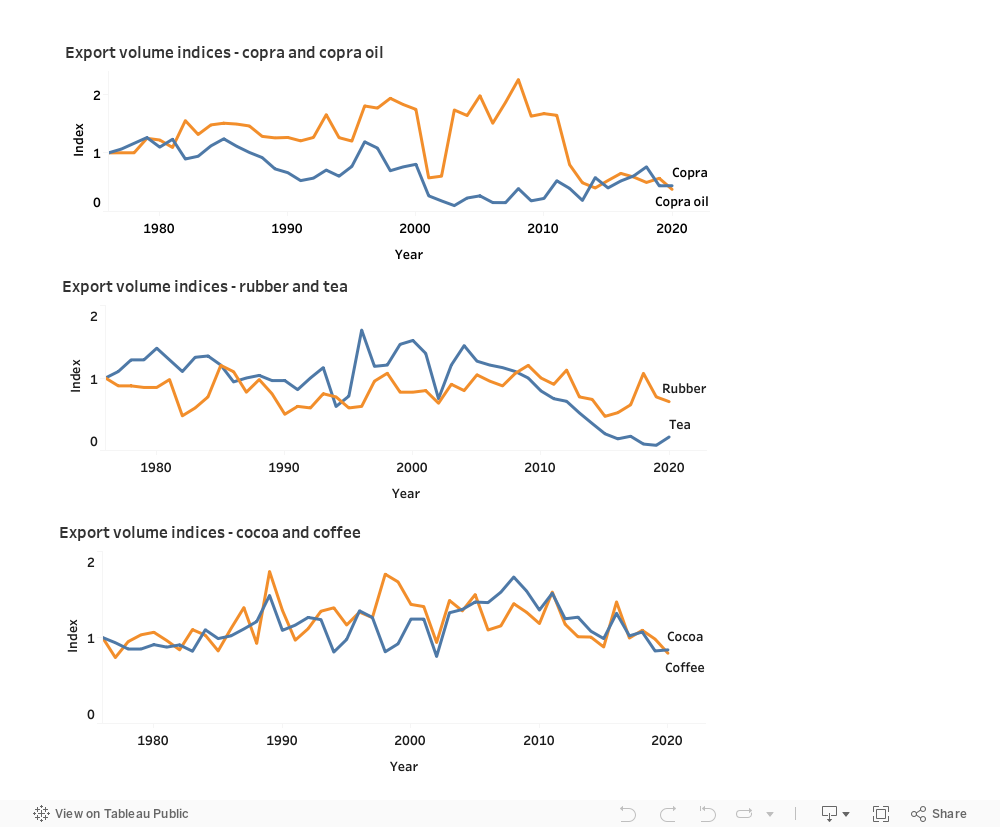
In fact, most agricultural exports show either a decline or no growth in volumes since independence: as shown below, this is the case for copra, copra oil, rubber, tea, cocoa and coffee.
Unfortunately, the earlier claim by Bourke and Allen (2009) that cash crop export volumes are at a higher level than at independence is now only true for palm oil. Twenty times as much palm oil is now produced as at independence (an annual average growth of 7.5 per cent). Marine product and log exports have also grown rapidly. The latter had a mini-boom in the mid-1990s, and overall have grown at an annual average rate of 4.5 per cent. Marine products have grown even more rapidly than palm oil, though they did start from a much lower base. They were first counted in 1990 but have since grown at an annual average rate of 18.9 per cent. There is no volume index for the category of other (non-traditional) agricultural products, but since 1990 (the first year in which it was recorded) its value, adjusted for inflation, has grown by an annual average of 6.1 per cent.
As a result of these very different trends, the composition of the non-resource export bundle has changed completely. At independence, coffee was by far the most important crop by value, followed by cocoa. Together, these two made up two-thirds of non-resource exports. Now, they make up just over 10 per cent. Palm oil and timber now each make up just over 20 per cent each: palm oil volumes have grown faster, but, as discussed below, timber prices have risen more. Marine product exports have become even more important, and now make up 28 per cent. Other (non-traditional) agricultural products at 10 per cent are more important than coffee (9 per cent) and other traditional agricultural exports.
We turn now to resource exports. Gold and copper have been exported since independence. Gold is the stand-out performer, with production more than tripling by volume since independence. Copper production is now only at half the level of independence. Oil exports began in 1992, peaked by volume the following year, and have fallen ever since. Cobalt and nickel started in 2012 and LNG in 2014. It is striking that there is no significant increase in the volume of resources exported during the resource boom years of the 2000s. We shall see that the boom of this period was rather driven by resource prices.
Turning now to the value of resource exports, at independence, copper sales dominated. Now LNG does, followed by gold.
The figure below shows aggregate export terms of trade for PNG from the IMF. The series uses exports as a share of GDP as weights, adjusting them over time, which means that the index can be interpreted as a measure of the windfall gain associated with commodity price increases (Gruss and Kebhaj, 2019). This figure is indispensable for an understanding of PNG’s economic history. Apart from a minor rise in commodity prices immediately after independence, the 1980s and 1990s were a period of commodity price decline. Then, everything changed. Commodity prices rocketed upwards and, despite a mild decline in recent years, are still above their level at independence. PNG’s economic turnaround in the 2000s finds a clear explanation in this trajectory.
Resource commodity prices have increased much more than non-resource prices. The figure below shows USD price indices over time relative to 1976 for PNG’s three most important non-resource commodities for which data are available (palm oil, logs and coffee) and for gold and copper, the two resource commodities exported since independence. Cocoa, coffee and palm oil show only moderate price growth. By contrast, the price of logs is now four times as high as it was in 1976. This no doubt reflects the fact that PNG is one of the few suppliers of tropical woods; in coffee and palm oil, by contrast, there has been massive growth in global supply, pushing prices down. Resource prices have done even better, with the copper price more than six times as high, and the gold price more than 10 times as high in the 2010s as in 1976.
We close the discussion by showing absolute growth in export value from the four major commodity sectors: resources, agriculture, marine products and timber. We deflate nominal values by CPI. The real value of agricultural commodity production has declined, with the rapid growth in palm oil volumes and other agricultural products unable to offset the lack of growth in other sectors, and the lack of price improvement. Timber values have gone up but have never recovered their importance of the mid-1990s, when they briefly exceeded agricultural exports in value. Marine products have shown rapid growth in recent years. Resource commodity exports have performed strongly for most of the post-independence period, with an annual average growth of 5.1 per cent.
Data notes on commodities
Next series: Employment