Running faster to stand still: Australian development NGO fundraising costs
By Jonathan Wilson, Jonathan Pryke and Stephen Howes
26 November 2015
This blog post continues our series looking into the finances of Australia’s aid or development NGOs. In the past we have focused on the changing size and sources of NGO revenue. In this post we take a look at how NGO expenditure has changed over the past decade, in particular in relation to the issue of spending money to raise money.
We aggregate and analyse data from the 20 biggest Australian development NGOs (in terms of total revenue from all sources). They make up approximately 85% of total sector funding. A follow-up post will take a look at these trends at the individual NGO level. The analysis is based on publicly available data from 2002/03 to 2012/13 taken from NGO annual reports.
As a quick refresher, we have already shown how public giving to development NGOs has flatlined since 2007, with NGO revenue growth being driven largely by increased funding from the Australian government. This has resulted in a game of snakes and ladders between NGOs in Australia.
Turning to the expenditure side, over the past decade, total expenditure, including that of revenue received from government grants, by the top 20 development NGOs in Australia has increased by 81% after inflation. Over the same period, funding for development projects as a proportion of total expenditure has decreased from 77% in 2002/03 to 74% in 2012/13. At the same time, Australian development NGOs have gotten leaner, with overall administrative costs falling from 9% to 7%. This difference is made up by a steady increase in fundraising costs, up from 10.5% to 13% since 2002/03. (Other expenses, not shown in Figure 1, such as community education, have also grown from 4% to 6%.)
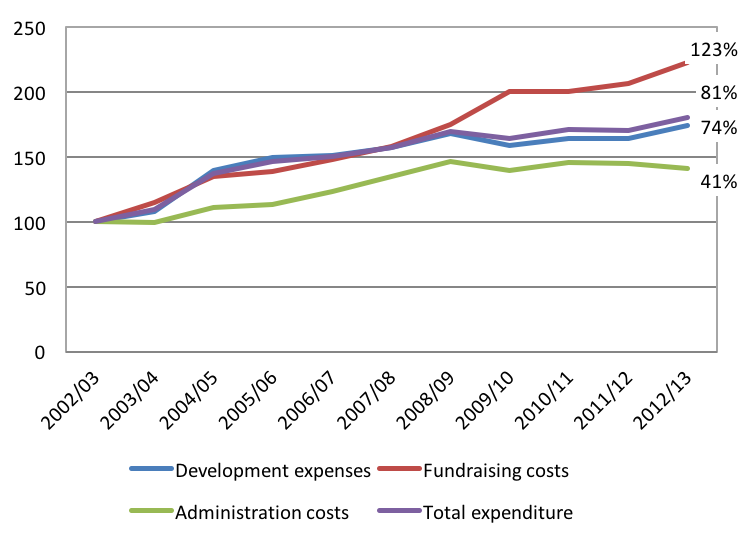
Figure 1 illustrates the growth (in inflation adjusted terms) of different types of NGO expenditure. While administrative costs have only increased by 41% in the last decade, fundraising costs have more than doubled, growing by 123%. Funding for projects, meanwhile, has grown by 74%.
Figure 1: Index of different types of NGO expenditure (2012/13 constant prices; 2002/03=100)
Notes: Other minor expenses – such as community education – are excluded from the graph above. For sources, see the end of the post.
Note that the growth in fundraising costs was largely in line with the growth in development until leaping ahead in 2008/09, a year after public donations flatlined.
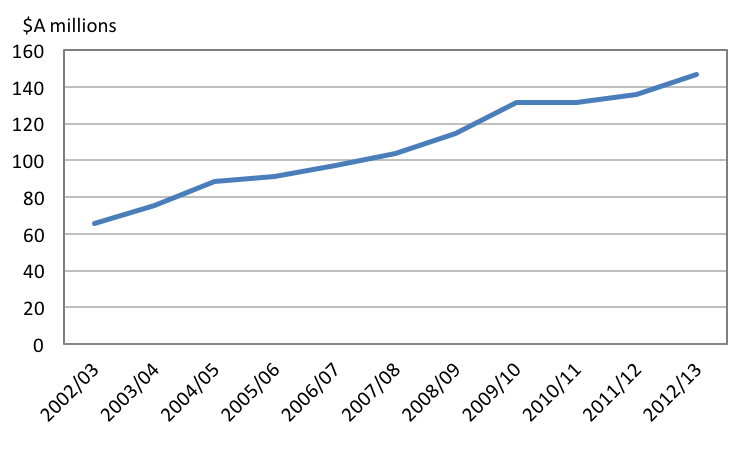
Figure 2 takes a closer look at the fundraising costs of the top 20 Australian development NGOs. They have increased sharply, from $66 million in 2002/03 to $147 million in 2012/13.
Figure 2: Scale-up of fundraising costs (2012/13 prices)
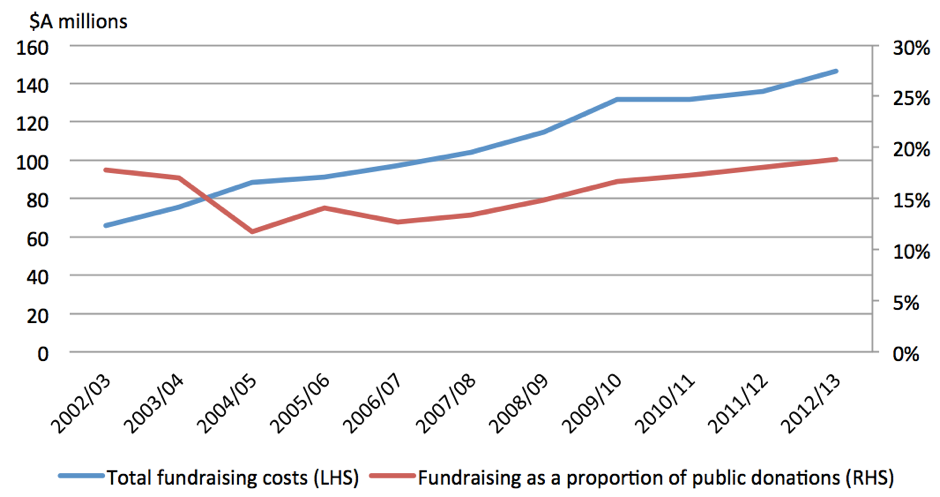
To look at the effectiveness of these fundraising expenses we need to look at the ratio of fundraising expenses to donations from the public rather than all funds. (About 70% of NGO funds are from the public. Most of the rest comes from the Australian government.) After falling to 12% of donations in 2004/05 (a by-product of the surge of donations following the 2004 Boxing Day tsunami), fundraising expenditure has steadily increased as a share of public donations and now sits at 19%, slightly higher than it was in 2002/03.
While fundraising costs have increased by 50% between 2006/07 and 2012/13, public donations have only grown by under 2% after inflation. In 2006/07, for every dollar spent on fundraising the sector received $8 from the public. By 2012/13 this ratio had fallen to $5.30.
Figure 3: Declining returns on fundraising (2012/13 prices)
What does this all mean? Of course, spending money to raise money is essential. And it is very hard, if not impossible, to say what the optimal level of fundraising expenditure is (ditto administrative expenditure).
What we can conclude is that the efficiency of fundraising in the sector seems to be on the decline. While fundraising costs have increased by 50% since 2006/07, there has been no discernible shift in the volume of public donations. Possibly such stagnation in the face of increased effort reflects something outside of NGO control – a hardened, less generous public. Possibly this increased fundraising effort is required to sustain the large increase in giving at the time of the Asian Tsunami in 2004. There may also be one-off factors involved, such as upfront investment costs in a transition to digital fundraising.
However, it is also possible that the increased fundraising effort is simply diverting donors from one NGO to another rather than increasing or sustaining the overall pool. Under this scenario, less fundraising effort wouldn’t mean fewer donations for the sector as a whole, but rather less competition between development NGOs.
The observed trends also raise the worrying possibility that a form of fundraising fatigue is setting in amongst the Australian public, and that enthusiasm for giving has waned, or at least plateaued, not despite but at least in part because of increased fundraising effort. Funds spent on fundraising are designed to be noticed. More and therefore more noticeable fundraising efforts may have turned people off, by making them think that too much of what they give will not reach the poor.
While a definitive verdict is beyond us, the warning lights are flashing.
Jonathan Wilson is completing a Master of International and Development Economics at the Crawford School of Public Policy, ANU, and interned with the Development Policy Centre in 2015. Jonathan Pryke is a Research Fellow in the Myer Foundation Melanesia Program at the Lowy Institute. Stephen Howes is Director of the Development Policy Centre.
Notes: All the analysis in this post of the top 20 development NGOs is by total revenue received in 2012/13 – they are listed individually in the next post in this series. WWF and The Salvation Army have been excluded from the analysis because of difficulties separating financial information of their development activities from domestic activities they are involved in. All data were sourced from publicly available information in individual NGO annual reports. The full dataset, compiled by one of the authors (Wilson), is available here.
Public donations are monetary and non-monetary contributions received free of charge from the general public. They do not include financial support in the form of gifts or donations received through wills or grants from philanthropic organisations and corporate entities. These are reported in the categories “Legacies” and as part of “Other grants” respectively in the dataset.
About the author/s
Jonathan Wilson
Jonathan Wilson interned at the Development Policy Centre in 2015 through the Australian National Internships Program (ANIP), researching the economic determinants of public giving to Australian NGOs. He also worked as a Research Assistant at Devpolicy in late 2015, providing support with data for the Australian Aid Tracker.
Jonathan Pryke
Jonathan Pryke worked at the Development Policy Centre from 2011, and left in mid-2015 to join the Lowy Institute, where he is now Director of the Pacific Islands Program. He has a Master of Public Policy/Master of Diplomacy from Crawford School of Public Policy and the College of Diplomacy, ANU.
Stephen Howes
Stephen Howes is Director of the Development Policy Centre and Professor of Economics at the Crawford School of Public Policy at The Australian National University.
