Snakes and ladders: development NGOs in tough times
By Jonathan Pryke and Stephen Howes
2 March 2015
In a post earlier this year we highlighted that since about 2006 public giving to international development NGOs has flatlined, just keeping up with inflation. We are now only giving nine cents in every $100 we have after tax to the overseas poor, down from 14 cents at the height of our generosity in 2004 and 11 cents in 2007. While we are still getting richer, we are also getting stingier.
It’s a dismal story, but what does it mean for individual NGOs? ACFID membership [pdf] has grown rapidly over the last few years, from under 80 members in 2008 to over 120 in 2014, but total AFCID income has not increased, so we have many more NGOs sharing an essentially static pie.
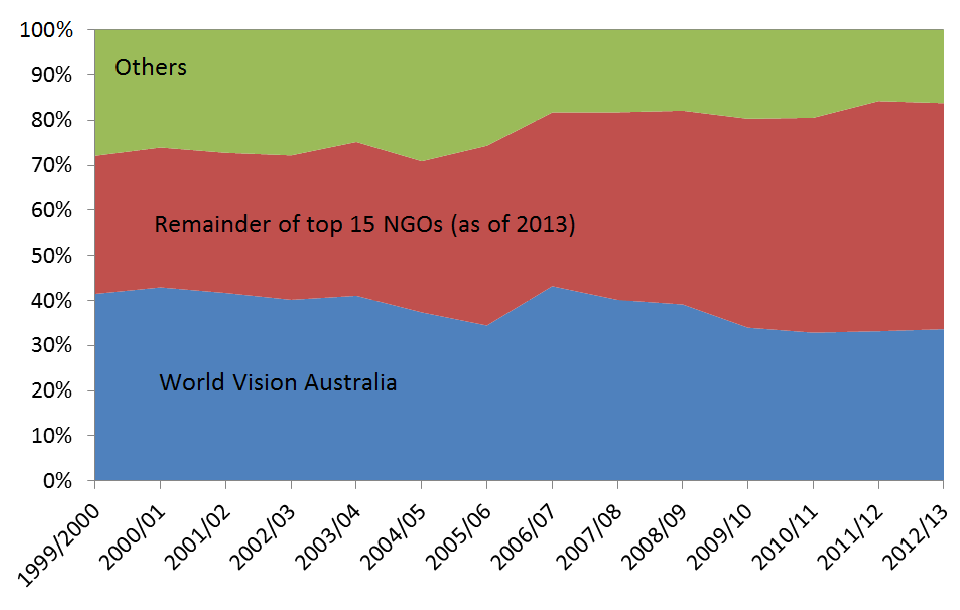
While the average ACFID NGO today must receive less from the public than five years ago, there are some big winners and losers. We focus here, as in our 2013 analysis, which ended in 2010/11, on the top 15 development NGOs ranked by their community donations in the most recent year for which we now have data, 2012/13. World Vision’s share is now steady at a third, and the other 14 are taking an increasingly large share, almost 50% by 2013. (Just a reminder that our universe is all ACFID-member NGOs plus two big non-ACFID development NGOs, MSF and Compassion. And that we are only looking at public donations, not government support.)
Figure 1: Share of donations over time – World Vision Australia (WVA) and others
Note: Dataset and working available here.
If we look just at the last two years — updating our earlier analysis, which finished in 2010/11 — we can see that most of the top 15 experienced growth, some very rapid growth. Note the recent fundraising success of the two UN agencies for refugees (UNHCR) and for children (UNICEF). Our 2013 analysis, identified seven high-growth or “insurgent” NGOs. Most of these enjoyed high growth in donations in the last two years as well. But Compassion and SCF are no longer in the high-growth group.
Figure 2: Growth between 2010/11 and 2012/13 (adjusted for inflation; in 2012/13 dollars): top 15 NGOs
: top 15 NGOs") Most of the aid losers in the last two years are in fact outside of the top 15. As shown in Figure 3, the 12 of the top 15 NGOs that experienced an increase in donations in the last two years got a combined increase of $44 million. The three of the top 15 that lost saw a drop in donations of $25 million. And the NGOs outside of the top 15 saw a combined fall of $25 million as well. (Overall public donations to development NGOs fell over the last two years by $6 million.)
Most of the aid losers in the last two years are in fact outside of the top 15. As shown in Figure 3, the 12 of the top 15 NGOs that experienced an increase in donations in the last two years got a combined increase of $44 million. The three of the top 15 that lost saw a drop in donations of $25 million. And the NGOs outside of the top 15 saw a combined fall of $25 million as well. (Overall public donations to development NGOs fell over the last two years by $6 million.)
Figure 3: Winners and losers in the last two years (adjusted for inflation; 2012/13 prices)
") Figure 4 takes a longer term view of the changing ranking of Australia’s top development NGOs since the turn of the millennium. We use shares of donations to all development NGOs as our measure, and exclude World Vision from the figure (since it is singled out in Figure 1, and would require a very different scale). As Figure 1 shows, World Vision still stands alone in the development sector, though its dominance is reduced. There has been considerable churning among the 14 other top 15 NGOs. In 1999/2000 there were, in terms of public fundraising, five “second-tier” development NGOs: Oxfam, ChildFund, Caritas, Compassion and CBM, all with shares of about 4% or $15 million (in 2012-13 prices). In 2006/07, there were three second-tier fundraisers: Oxfam, Compassion and MSF, all with shares of 5% or $40-50 million. Today there are two: Compassion and MSF, both with a share in excess of 7% (or about $65 million). Oxfam is now a “third-tier” fundraiser alongside Fred Hollows (both with shares of around 5% or $43 million). ChildFund and Caritas have moved down into the fourth-tier.
Figure 4 takes a longer term view of the changing ranking of Australia’s top development NGOs since the turn of the millennium. We use shares of donations to all development NGOs as our measure, and exclude World Vision from the figure (since it is singled out in Figure 1, and would require a very different scale). As Figure 1 shows, World Vision still stands alone in the development sector, though its dominance is reduced. There has been considerable churning among the 14 other top 15 NGOs. In 1999/2000 there were, in terms of public fundraising, five “second-tier” development NGOs: Oxfam, ChildFund, Caritas, Compassion and CBM, all with shares of about 4% or $15 million (in 2012-13 prices). In 2006/07, there were three second-tier fundraisers: Oxfam, Compassion and MSF, all with shares of 5% or $40-50 million. Today there are two: Compassion and MSF, both with a share in excess of 7% (or about $65 million). Oxfam is now a “third-tier” fundraiser alongside Fred Hollows (both with shares of around 5% or $43 million). ChildFund and Caritas have moved down into the fourth-tier.
Figure 4: Proportional share of donations among top 15 NGOs, excluding World Vision
 Note: Data for asterisked NGOs start in 2003/04. For these NGOs, the 1999/2000 bar shows 2003/2004 data and the annualised growth rate is instead for the 2003/2004–2012/13 period.
This analysis raises a number of questions. There is the awkward reality that the second and third largest development NGOs in Australia (MSF and Compassion) are becoming increasingly important but choose not to be members of the peak body, ACFID (for reasons that require a separate post). And for NGOs more generally, there is the question of whether the churning we observe is a zero-sum game. The fact that some NGOs are charging ahead with their fundraising while total giving is flat does not necessarily mean that those who are thriving are doing so at the expense of those who are struggling, but this must certainly be a risk.
Jonathan Pryke is a Research Officer, and Stephen Howes is the Director of the Development Policy Centre.
Note: WWF appears in the ACFID data as one of the top 15 fundraisers among ACFID members, but is excluded from this analysis as the majority of their funding from the community is directed to domestic campaigns. Its funds are, however, still included in the ‘total’ amount of community funding to development NGOs.
The NGO ladder – top 15 development NGOs (by community contributions) 2012/13
- World Vision Australia
- Compassion Australia
- Médecins Sans Frontières
- Oxfam Australia
- The Fred Hollows Foundation
- ChildFund Australia
- Save the Children Australia
- PLAN International Australia
- Global Development Group
- UNICEF Australia
- Caritas Australia
- Australia for UNHCR
- CBM Australia
- CARE Australia
- Opportunity International Australia
About the author/s
Jonathan Pryke
Jonathan Pryke worked at the Development Policy Centre from 2011, and left in mid-2015 to join the Lowy Institute, where he is now Director of the Pacific Islands Program. He has a Master of Public Policy/Master of Diplomacy from Crawford School of Public Policy and the College of Diplomacy, ANU.
Stephen Howes
Stephen Howes is Director of the Development Policy Centre and Professor of Economics at the Crawford School of Public Policy at The Australian National University.
