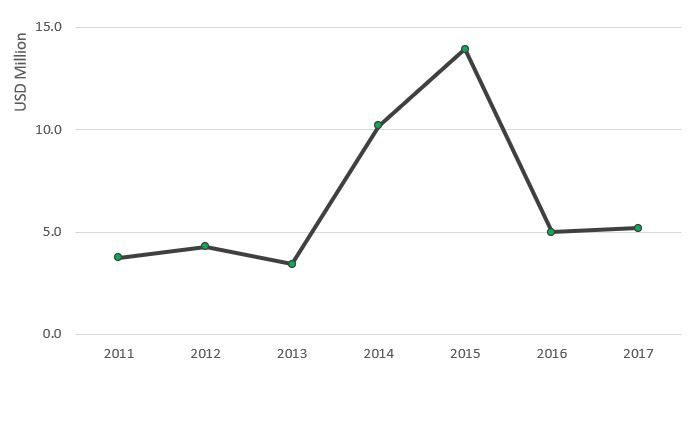
New Zealand aid to Tuvalu
The volatile waters of Pacific aid
By Terence Wood
1 June 2021
Years ago, I hitchhiked from Weipa, down the Cape York Peninsula to Kuranda, in the hills behind Cairns. Beautiful country, but I don’t remember much of it. Mostly I remember discomfort as the Land Rover clattered hectically over serrated dirt road, and jolts of fear as we plunged in and out of dry river beds. When we finally hit smooth tarseal, I was very, very relieved.
As it is with roads in Northern Queensland, so it goes with aid. If you’re a recipient, aid flows are much easier to manage when they are smooth and steady. Aid that bounces up and down can derail fiscal planning, and destabilise everything from government departments to local communities. Good aid arrives at a consistent pace. Increases are okay, as are falls, but they need to occur over a period of years, not overnight.
The technical term for aid flows that bounce around is volatility. In our recent open access Asia & the Pacific Policy Studies article, Imogen Nicholls and I examined aid volatility in the Pacific. (We also looked at fragmentation, but, for the sake of a succinct blog, I will focus on volatility here.)
We had good grounds for taking an interest in aid volatility in the Pacific. It’s the world’s most aid dependent region. And by some measures, the countries of the Pacific also receive some of the world’s most volatile aid.
We based our analysis on the Lowy Institute’s Pacific Aid Map data set, using data on government aid covering 2011 to 2017. Pacific Aid Map data meant we could include newer donors like China in our analysis, as well as OECD Development Assistance Committee (DAC) donors like Australia and New Zealand.
As we studied volatility, we looked at donor-recipient pairs. We studied how volatile aid from a particular donor (New Zealand, for example) was to a particular recipient (Tonga, for example). We did this because pairs of this sort are at the heart of aid giving. If you’re a recipient government (Tonga, to continue our example), and New Zealand’s aid bounces around from year to year, it’s going to be hard to manage, even if some other donors give fairly stable aid. And if you’re a donor, for example New Zealand, while you can’t control what other donors do, you can mend your own ways. We also took care to remove trends of steady change from our measure of volatility. We were interested in rapid, short-term change, not slower change of the sort that can be planned for. Finally, we excluded humanitarian emergency work from our analysis. Emergencies happen in a hurry: it’s understandable that aid responding to such situations will be volatile.
In most of the article we focused on larger donors, both for simplicity’s sake and because they have a larger impact.
Full details of our methods and results are in the article, but here’s the essence of what we found.
Volatility varies a lot between Pacific countries. The figure below shows you this. Palau received the most volatile aid. Solomon Islands received the least volatile.
Volatility of aid from the median donor (in terms of volatility) among the five largest donors to each recipient among the five largest donors to each recipient")
We can only provide tentative answers as to why some countries get more volatile aid than others, but it seems possible that being smaller leads to worse volatility. Also, countries receiving aid that is fragmented across many projects are more likely to suffer greater volatility (once population is controlled for). We can’t confidently claim that greater project fragmentation causes more volatile aid, but some Pacific countries are suffering a twin burden: aid that is both too volatile and broken into too many discrete projects. These countries deserve better aid coordination.
We also studied which donors gave the most volatile aid. When we did this, we continued to look at donor recipient pairs and focused mainly on the 15 largest donors in the Pacific. Once again we found variation.
Volatility by donor (to their median Pacific recipient in terms of volatility)")
Australia and New Zealand gave the least volatile aid. China, to pick a topical donor, didn’t do as well, but was far from the worst performer. Taiwan gave the most volatile aid, followed by France. We could find no obvious explanations for why some donors gave more volatile aid than others. However, when we ran regressions using all donors to the Pacific, not just the top 15, we did find that, on average, newer non-OECD DAC donors tended to give more volatile aid than their DAC counterparts. If there is a group of countries that needs to work hardest on giving stable aid in the Pacific, it is these newer donors.
The Pacific region receives some of the most volatile aid on earth, but not all countries in the Pacific experience the problem equally. And not all donors are equally to blame. The challenge in coming decades will be for some of the region’s newer donors to start demonstrating a sustained commitment to supporting the Pacific. This will require giving aid well – including managing volatility.
This piece is based on an article in the Asia & the Pacific Policy Studies journal, “Aid fragmentation and volatility in the Pacific” by Terence Wood and Imogen Nicholls. All articles in the journal are free to read and download.
Disclosure
Terence Wood’s research on aid is undertaken with the support of The Bill & Melinda Gates Foundation. Development Policy Centre research on aid in the Pacific is undertaken with the support of the Pacific Research Program. The views expressed here are those of the author only.
About the author/s
Terence Wood
Terence Wood is a Fellow at the Development Policy Centre. His research focuses on political governance in Western Melanesia, and Australian and New Zealand aid.
