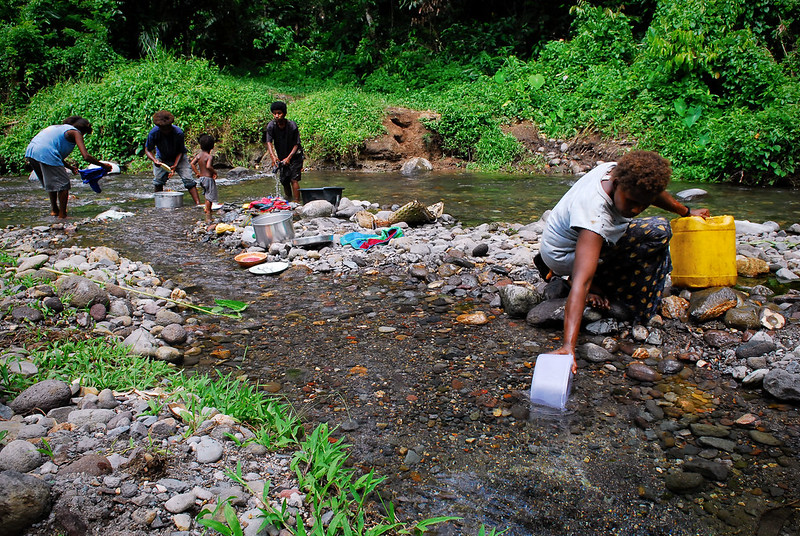
Fetching water from a stream in PNG
PNG’s MP funding: volatile and unaccountable
By Maholopa Laveil
8 July 2021
District Services Improvement Program (DSIP) funds in Papua New Guinea (PNG) are not unique. Similar systems can be found in neighbouring Solomon Islands and in some other developing countries where the funds are often referred to as Constituency Development Funds (CDFs). In PNG, DSIP funds are allocated to each open Member of Parliament (MP), and have been volatile since first introduced in 1984. In this post I compare PNG’s DSIP volumes to CDFs globally, and describe trends in DSIP expenditure.
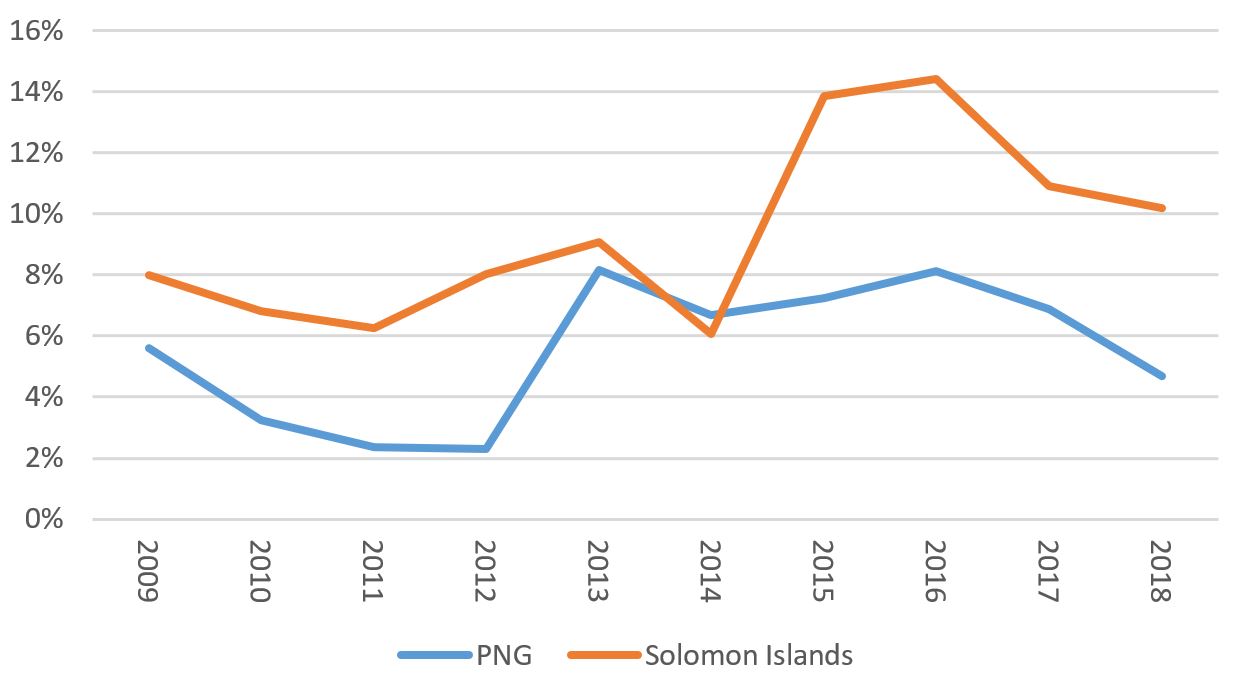
PNG’s DSIP spending was some of the highest in the world a decade ago. The 2014 Promoting Effective Public Expenditure (PEPE) report showed that PNG’s DSIP in 2009 as a share of total expenditure (5.6 percent) was the second highest among a number of developing countries (Solomon Islands was the highest at 8 percent). In 2009, PNG disbursed DSIP funds of US$1.6 million per MP (K4.5 million), leaving it second only to the Philippines (US$4.3 million) when compared to the countries included in one major international report.
Of the two countries with the highest DSIPs as a share of total expenditure in 2009, the Solomon Islands continued to spend more from 2010 onwards (except in 2014). Both PNG and the Solomon Island’s shares have been volatile, however. For Solomon Islands this share has been higher than 10 percent since 2015. In PNG, it was 3 percent and relatively stagnant between 2010 and 2012, before increasing to 8 percent in 2012 and 2016. PNG’s DSIP share of total expenditure was 6 percent in 2019.
DSIPs as a share of total expenditure, 2009–2018
PNG’s DSIP funds began in 1984, as the National Development Fund. Under this fund, DSIPs were budgeted at K10,000 for each open MP, and grew to K10 million in 2013. By 2020, a total of K890 million (K10 million per open MP) was allocated to DSIPs, comprising 15 percent of PNG’s capital expenditure (CDFs were 48 percent of Solomon Island’s capital expenditure).
Actual DSIP funds disbursed since 2013 have failed to meet their budgeted targets. This is because, in years when government revenue fails to meet budget targets, capital expenditure is reduced to accommodate this shortfall. As DSIPs comprise a large share of capital expenditure, DSIP funds tend to fall when revenue falls.
The figure below shows real (adjusted for inflation) DSIP funds disbursed, with real expenditure and real revenue (excluding grants) since 1984. There have been four spikes in real DSIP funds, in the periods: 1993-1995, 1999, 2006-2008, and 2013. In 1993-1995, government revenue rose as log and coffee prices increased. This enabled real DSIP funds to increase by 178 percent. The spike in 1999 resulted from the introduction of the Value Added Tax (now GST) increasing government revenue, and BPNG financing government expenditure beyond its limit, enabling each open MP to receive K1.5 million (up from K0.3 million in the previous year). This allowed real DSIP funds to increase by 335 percent. The figure below does not show an increase in real expenditure and revenue during the spikes of the 1990s because of high inflation in the 1990s.
The spike from 2006 to 2008 was again caused by a surge in government revenue driven by increases in log and mineral prices, enabling real DSIP funds to increase by 403 percent. In 2013, DSIP funds increased again, as a boost in income and profit taxes from the construction phase of the PNG LNG project allowed higher budget allocations. This enabled DSIP funds to increase by 258 percent. Since the 2013 increase in revenue, nominal DSIP volumes have been higher than in the 1980s, 1990s, and most of the 2000s.
Nominal DSIP funds between 2013 and 2017 were higher than in 2008, but in real terms they were lower and subsequently fell as prices increased. A fall in DSIP funds occurred in 2018, caused by a diversion in expenditure in response to a large earthquake that year. As a result, real DSIP funds fell by 20 percent.
DSIP funds disbursed to each MP were K8 million in 2019 and 2020 (in real terms, K5.6 million and K5.3 million, respectively). This was K2 million lower than budgeted. The reduction in DSIP funds in 2019 reflected a downward revision in budget expectations for revenue. In 2020, the pandemic led to lower revenue and a diversion of expenditure to health, security and economic recovery, reducing DSIP funding.
Real expenditure, revenue and DSIP per MP (K’ millions), 1984–2019, base year = 2012

Between 2012 and 2016, the guideline for DSIP spending was: 30 percent for infrastructure, 20 percent for health service improvement, 20 percent for education, 10 percent for law and order, 10 percent for economic support, and 10 percent for administration. This was relaxed in 2016 and left largely to MP discretion.
Little DSIP funding reached primary schools and clinics in 2014, according to the PEPE report. Further, a number of projects were behind schedule and left incomplete. This has not improved recently, with reports of a number of DSIP development and infrastructure projects left incomplete and of low quality. The Department of Implementation and Rural Development (DIRD), tasked with monitoring DSIP expenditure and projects, last reviewed DSIP spending in 2016. In its 2016 report, only 16 of the 89 open electorates were visited.
In summary, DSIP funds have risen in the long run. In the short run, DSIP funds have tended to rise and fall with fluctuations in government revenue. This volatility coupled with poor governance surrounding DSIP spending continually limit PNG’s ability to meet its development goals.
Note
The author thanks James Batley for CDF data from the Solomon Islands. The author is also grateful to Professor Jon Fraenkel for DSIP data from 1984 to 2010, adapted from ‘The political economy of economic reform in the Pacific’. DSIP data from 2011 to 2020 were sourced from budget documents available on the PNG Treasury website. The DSIP data reported on in this post can be downloaded here.
Disclosure
This research was undertaken with the support of the ANU-UPNG Partnership, an initiative of the PNG-Australia Partnership. The views represent those of the author only.
About the author/s
Maholopa Laveil
Maholopa Laveil is an economics lecturer at the University of Papua New Guinea.
