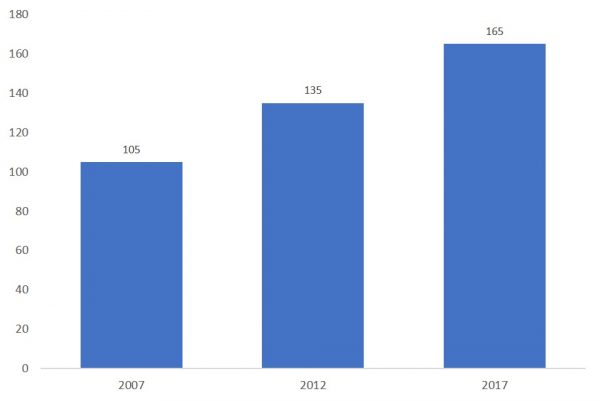
National elections are hard for women candidates in Papua New Guinea. In the 2012 general election only 3.9% of candidates were women. In this year that number has increased to 4.9%. Three point nine to four point nine does not sound like a huge gain. But, as the chart below shows, it’s actually a 22% increase in the absolute number of women standing: from 135 to 165. Unfortunately, I do not have data on candidate gender in the PNG Election Results Database for years prior to 2007, but this year’s increase is part of a steady rise in women candidate numbers since at least 2007.
Number of women candidates in national elections in PNG
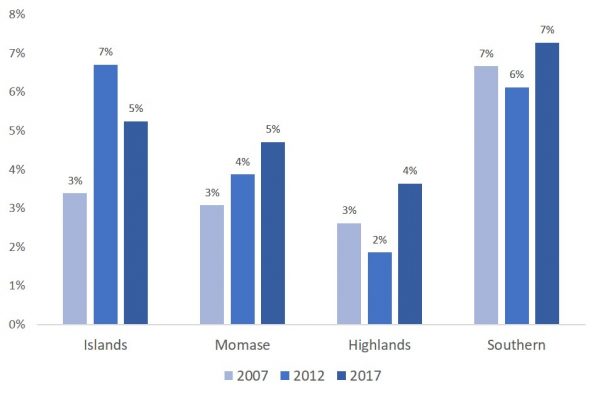
Numbers are going up nationally but the rise in women candidate numbers has been felt unevenly around PNG. In three of the country’s four regions women candidate numbers went up as a share of total candidate numbers. However, in the Islands Region the share of candidates who were women fell.
Percentage of total candidates who are women, by region
 This unevenness is even more apparent when we look at individual electorates. Each dot in the scatter plot below represents an electorate. Its location along the x-axis reflects the percentage of candidates who were women in that electorate in 2012. Its location along the y-axis reflects the percentage of candidates in this election who are women. The diagonal line plots the one-to-one relationship. Electorates on or close to that line have a similar share of female candidates this election to last. Electorates that are a long way from the line have seen significant change. As you can see almost all electorates changed, most significantly. Some–the ones I’ve labelled–were transformed one way or another — either a much greater share of women candidates or a much lower share. In Talasea 20 per cent of candidates were women in 2012. This year there are no women. In North Wahgi, Middle Fly and Kompiam Ambum there were no women standing last election. This election just over 10 per cent of the candidates in electorate are women.
Women candidate shares by electorate, 2012 and 2017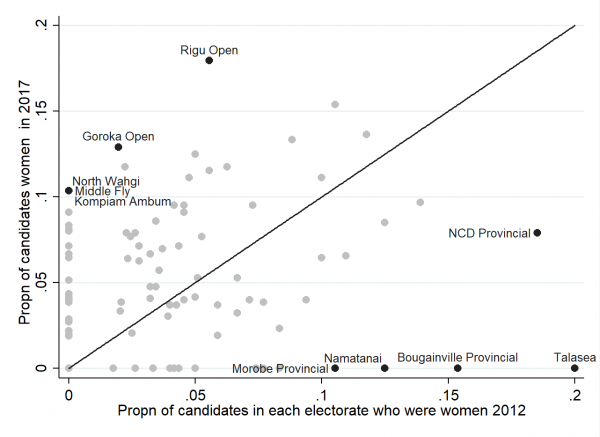
Explaining this variation is another part of the puzzle of women candidates in PNG. Possibly, the change is a product of some form of demonstration effect: although one woman was quite competitive in Bougainville Provincial seat in 2012, in Talasea Open, Namatanai Open and Morobe Provincial all of the women who stood finished towards the tail of the field. Perhaps that put women off in 2017? That said, women candidate numbers have gone up considerably in Rigu despite the fact the two women who stood there in 2012 polled poorly.
There is an urgent need for more women MPs in PNG. There is also a lot left to be learnt about woman candidates, their aspirations, their experiences, and their successes and failures.
If you want to look at the data this post is based on, you can download them here.
Terence Wood is a Research Fellow at the Development Policy Centre.

While I’m online I’ll also note that my total number of women candidates varies very slightly from some other published numbers (i.e. http://www.looppng.com/tags/2017-election-candidate-numbers). When I get better data I’ll look into this. For now though the difference is too small to affect analysis.
Hi Terence. I don’t disagree with your conclusions, but just want to make the point that the Bougainville seat is not a ‘provincial’ seat (Bougainville not being a province). It is called ‘Bougainville Regional’.
Thanks David. Point noted. The names are a function of how I store the data in the PNG Election Results database. When I get time, if I can make it work, I’ll look into amending the database.