
Let’s be clear from the start: there’s no good way to decide where to cut one billion dollars from a five billion dollar aid program in just six months. Indeed, there’s no good reason to make the cut. Aid is less than 1.5 per cent of Australian federal government spending: too small for changes to have any real impact on the country’s fiscal health. Yet the cut will hurt people in developing countries. And it may well hurt Australia too. Promises will have to be broken in the international arena, and international goodwill (of the sort that helped get Australia onto the UN Security Council, for example) may be eroded.
At the very least, if cuts must be made, they should be made more slowly — over the space of several years. If this was the case, aid could be cut judiciously following careful performance assessments. But this won’t be possible in a space of six months. Only blunt heuristics will be available to guide the knife.
Reflecting these circumstances I’m going to offer two guides for where the cuts should land — guides geared to minimising development damage. Neither is great, but they are better than nothing, and combined they offer something to work with at a time when political decisions have ensured there is no good way forwards.
Both guides have the same underlying logic: minimising the ‘shock’ felt by any particular country as Australian aid is cut.
The first guide compares Australian aid to recipient countries’ GDPs and prioritises cuts in countries where Australian aid is small in comparison to GDP. The logic to this is simply that when aid is small in comparison to the recipient economy in question, the overall economic shock will be minimal. This is not a perfect means of choosing where to cut aid — it doesn’t guarantee that individuals currently benefiting from good aid projects won’t be hurt, but it does minimise the likelihood that whole economies will be buffeted by the cuts.
The chart below shows Australian aid as budgeted for the 2014/15 financial year as a percentage of recipient GDP. (For detailed descriptions of the data, sources, assumptions and limitations see the detailed note here. For now, the most important points to note are that, where country groupings are used rather than individual countries, this reflects the way DFAT has laid out its most recent aid budget data. Also, the Australian aid amounts used in the calculations for the chart are those from the DFAT country budgets for each recipient country, and so exclude Australian aid that may go to a recipient country via multilateral aid or other Australian government departments.
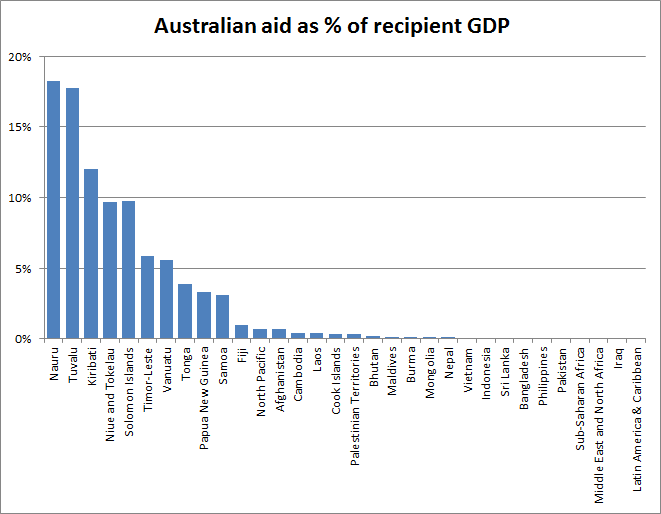 Certainly for countries where aid is more than five per cent of GDP, and probably for countries where aid is more than two per cent of GDP, a major aid cut would be risky (and one might err on the side of caution in countries such as Fiji, where the political situation is complex). This suggests that, with the exception of Niue and Tokelau where GDP data
are questionable and whose situation is supported by their relationship with New Zealand, there are a clear group of Pacific countries (and Timor-Leste) where large aid cuts would be unwise.
Aid to GDP isn’t a perfect guide though. There are limitations: countries can have large economies without much of this wealth trickling down to the average person, meaning the need for the sorts of services aid can fund remains high.
This brings me to my second guide to where cuts should fall. This approach focuses on reducing ‘aid shock’ by avoiding cuts to aid in countries where Australian aid is a large slice of overall aid. The figure below reflects this approach (for data details see the data notes referred to above). As with the chart above, each bar is an Australian aid recipient but this time the Y-axis plots Australian aid as a percentage of total aid.
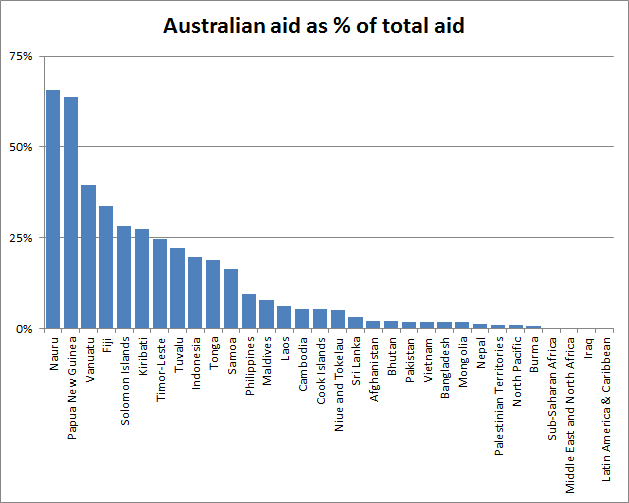 The charts aren’t identical, but there is considerable overlap at the upper end. Both charts suggest there are a number of Pacific countries (and Timor-Leste) where cuts could be expected to cause significant shocks. The overlap isn’t complete though, and so in this spreadsheet I have calculated the weighted average of each country’s rank in the two measures (the other sheets of the spreadsheet show background workings for the charts and detail data sources). Importantly, because most countries where Australian aid is high as a percentage of total aid are also countries where Australian aid to GDP is high, or countries such as Indonesia where other donors have started giving less because aid is needed less, it is, I think, reasonable to treat the aid to GDP measure as more important than aid to total aid measure. Reflecting this, I have weighted the average in favour of aid to GDP (0.75 to 0.25). If you disagree, you can change the weighting in the spreadsheet in cell E1 and see re-calibrated results (you can change any of the yellow cells in the spreadsheet, the rest of the cells are locked, though you don’t need a password to unlock them).
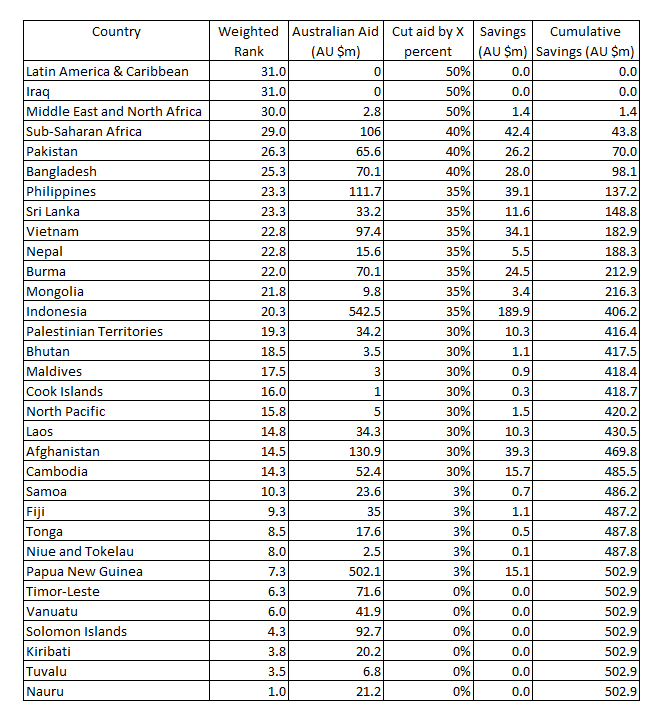
From the weighted average I’ve then (in the same spreadsheet) targeted where I think the cuts should fall in a way that minimises overall damage. The table below shows the output of this in its third column, where I’ve suggested a percentage aid cut. Once again, you may disagree with the percentage cut I’ve suggested for each country (rankings aren’t everything: perhaps, for example, you think the humanitarian situation in Palestine requires aid there not be cut). If you do disagree, go into the spreadsheet and change the percentage values in column G to values you think more appropriate and the changes will be reflected in the spreadsheet calculations. The final column of the spreadsheet shows the cumulative savings as they total over each of the recipient countries.
In addition to country savings, in his recent blog post, Robin Davies suggested savings could be found from regional programs of between 10 and 20 per cent (which I’ve averaged to 15 per cent for a total saving of $47.3m), as well as a ($351m) saving from ‘Cross Regional Programs’, further savings from UN and Commonwealth organisations ($32m), central NGO and volunteer programs ($20m), DFAT departmental spending ($50m) and aid given via other government departments ($39.2m). All up these savings tally to $539m. For the sake of easy maths and also because, pessimist that I am, I doubt all these savings will be realised, I’ve rounded this down to $500m, which leaves another $500 million to be found from country aid programs. Which, give or take a couple of million dollars, is what the savings tally to in my table.
 And that’s how I would suggest cutting one billion dollars from an aid program in a hurry. In practice my approach means big cuts born by parts of Asia and sub-Saharan Africa, so as to spare the Pacific. Such cuts are far from ideal, but it is hard to see a better alternative at this point.
Terence Wood is a Research Fellow at the Development Policy Centre. His PhD focused on Solomon Islands electoral politics. Prior to study he worked for the New Zealand Government Aid Program.


These figures (and all the figures I come across on Australian aid expenditure) never provide answers to the important questions: how much of the total spend is on DFAT administration and management and consultants’ fees, how much is on recipient government/NGO administration and management, and how much is spent by local non-government actors actually relieving poverty or building capacity.
Why is this information not readily available? It’s the information that every disinterested citizen and taxpayer wants to know, but is seemingly denied to us.
Hi Vern,
Thanks for your comment. A good question.
With regards to government aid, the aid world is quite transparent about overheads, although its efforts at transparency are hampered by poor website design and maintenance.
The OECD DAC’s website provides detailed data on government donor expenditure and if you go to this link and then reconfigure the table (click on customise) and move country to the filter and aid type to the row field, and then filter for Australia you can find out how much money has been spent on staff and TA.
In the case of New Zealand (which I know best, being a New Zealander) we are also provided with very clear information on overheads in the government aid programme by our Treasury. I imagine this may well be the case in Australia too. (We make use of the NZ data in this paper, and report on NZ govt aid programme overheads, which average at around 10% of total spend; I suspect Australia is similar).
In the case of NGOs data can often be gathered from their annual reports (and if they don’t offer it, there’s no need to donate to them.)
Just as a more general point, while I agree that transparency on overheads is important, as I’ve written here, focusing on lowering them will often lead to worse aid, not better.
Thanks again.
Terence
Thanks Joel,
I agree that there are much better ways of cutting an aid programme. Just not in 6 months.
Similarly, while I think decisions might be made to stop working in a particular sector or cut spending to a particular multi-lat, I doubt any of this can be done as quickly as country-based cuts.
To be clear on the main point of my post: I don’t think there’s any good way of cutting an aid programme by 20% in 6 months. Nor any good cause for it. All I can offer is what I think is the least worst way forwards now.
Terence
Thank you for continuing to highlight the importance of this process Terence.
Cutting one fifth of the aid program will have a significant effect on millions of people’s lives and it deserves to have the best, and most transparent, process possible especially given the short time frame available.
No doubt the culling process will in some way involve proportional cuts to current country funding but I hope that DFAT does not use the model you propose which takes no account of the levels of need or likelihood of benefit of current projects. I understand and sympathise with your method. However focussing on the countries you suggest will make the program even less poverty focussed, is likely to cull many of the most cost effective activities and will reduce the aid program’s support for the extremely poor people who need it most.
Given the active monitoring and management of country programs by DFAT staff there is also no reason that the effectiveness and likely impact of activities could not be central to the selection process. Yes six months is a short time frame, but DFAT staff have access to the large body of evidence on the likely impact of different types of projects and they actively monitor the implementation, quality and impact of current activities. They are not starting with zero knowledge here.
It seems to me that it is quite feasible in this time frame to implement an effective, if not perfect, system for assessing the likely impact and cost effectiveness of each major activity and making informed culling decisions within and across countries on this basis, in association with other pragmatic factors.
Thanks Garth. And I agree with some of what you say. In terms of your proposed alternative, I your approach is definitely preferable if it is possible. However, I don’t think it is. I think that the amount of information on activity efficacy available to DFAT staff is less than you make it out to be. All the more so because of the AusAID re-integration.
That said, I could be wrong and maybe a better guide to cuts is possible. My fear though is that the cuts may possibly be guided by worse heuristics (i.e. geostrategic ones) and so part of the reason I have proposed my approach is that if the cuts land in significantly different places, we are then in a position to ask why. Perhaps we will be provided with good answers, in which case I will have no objection.
Also, WRT need. This needs to be thought of in terms of immediate need (depth of current poverty) and ongoing need (the odds of development progress that is not driven by Australian aid in the medium term). In terms of of immediate need countries such as Indonesia would obviously score highly, but in terms of ongoing need I would say Pacific countries such as PNG and Solomons are much more worth focus countries.
Thanks again.
Hi Terence,
Thanks for this. Interesting perspective and good use of data. Even though you provide sufficient caveats, I worry that such calculations and numeric contortions hide the more fundamental questions that DFAT needs to be asking as it looks for cuts:
– which programs are working and which are not?
– what can be achieved in a $4b aid program?
– do the cuts require a new strategy rather than just variations on the level of cuts (10% or 20% or 30%)?
I guess I am arguing that rather than having calculations drive the cuts, DFAT needs to re-develop its strategy and have that drive the cuts. Of course I doubt this will happen partly due to the tight timeline (cuts announced in December and first round of budget proposals needed in February) and partly due to the fact that redesigning the aid strategy less than a year after the launch of the new strategy in June 2014 would be an admission of complete failure.
I would prefer some bold (and likely unpopular) decisions by DFAT – pulling out of certain countries; cutting all work in certain sectors; ending contributions to certain multilateral agencies – that are based on a revised strategy of what the aid program can and should achieve.
Joel
Hi Terence,
Thanks for this-very interesting and possibly the only option to make aid cuts with the time constraints.
I am with Joel. I am against a holistic approach where we look at percentages and calculations as opposed to effectiveness of aid and impact caused by the aid. This makes me reflect on whether aid is given as a means to an end; or as an end in itself (is it meant to impact positively on development)
Will be interesting to see how this plays out.
Thanks Nancy,
To be clear: I agree with you, effectiveness should be our guide. But, thanks to political decisions, the timeframes are too short for much of this to be done. Given this case, I think the approach I offer is (at least as a starting point) the least worst option.
As to whether aid is given to assist development or for other reasons such as geo-strategy, like you I want my taxes to fund development. And one way of thinking about the the tool offered above is that it offers an approximate guide to the development impact of the cuts. And where we see deviations from those suggested above we should ask why. There may be good answers (i.e. DFAT might demonstrate they have good evidence to show that our aid to Pakistan is strongly justified on development grounds, or working very well) but it will fall to those deciding where the cuts will fall to offer this.