
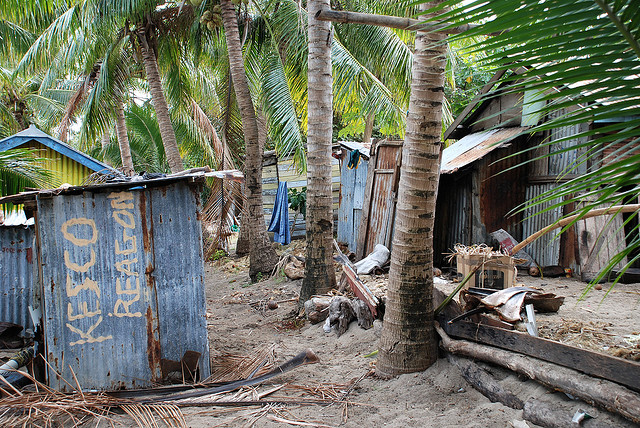
AusAID’s most recent assessment of poverty in the region, ‘Tracking Development and Governance in the Pacific 2009’, found that rising poverty is evident, with one-third of people living below national poverty lines.
According to the report, “poverty is a significant and growing problem for many countries in the Pacific, with approximately 2.7 million people… not having sufficient income or access to subsistence production to meet their basic human needs.”
Additionally, progress towards Millennium Development Goal number one — eliminating extreme poverty and hunger — has been slow.
Thus, the need to comprehensively measure poverty in the Pacific is critical, for four key reasons:
- to keep poor people on the policy agenda;
- to target aid interventions;
- to monitor and evaluate projects and policy interventions;
- and to evaluate the effectiveness of institutions.
In my recently released discussion paper for the Development Policy Centre, ‘Measuring poverty in the Pacific’ [pdf], I have examined how basic needs poverty is measured in the region, the limitations of current data and opportunities for further analysis.
The paper focuses on measuring poverty through examining a household’s command over commodities — an income measure of poverty. It uses a Basic Needs Poverty Line (BNPL) measure, which represents the level of income required to meet a minimum standard of living in a country. People falling below their national BNPL have insufficient cash income or access to subsistence production to meet minimum dietary needs and to cover basic expenses related to housing, health care, education, clothing, transport and customary and community obligations.
Unsurprisingly, there is disagreement among development experts on the cut-off for pronounced deprivations. This paper simplifies the approach by focusing on two conventionally accepted methods.
The first is to calculate the national poverty line based on the income required to meet a household’s ‘basic needs’ of food, shelter, etc (see Haughton and Khandker 2009, pp. 49-54). The second is to calculate an international poverty line, based on an average of national poverty lines and converted back in to local currencies using purchasing power parity (PPP) exchange rates (Haughton and Khandker 2009, p. 45).
Both of these approaches have their own strengths and weaknesses. National poverty lines are easier to calculate and provide a good measure of poverty in a given country. International poverty lines are more difficult to calculate because they require price data to estimate PPP exchange rates, but arguably they give a better measure of how poverty compares across countries. It is also the measure used in the MDGs.
The basic building blocks of measuring poverty are an indicator of welfare (income or consumption per person), a minimum acceptable standard (poverty line) and survey data (to aggregate a summary statistic). In practice most countries measure poverty at a household level rather than per person because it is easier to design good surveys for doing this, and a range of surveys can be used. Living standard surveys are widely used in developing countries and household income and expenditure surveys are used throughout the Pacific.
Household income and expenditure surveys (HIESs) provide information on people’s living conditions and income/expenditure patterns. Data from HIESs are used for rebasing a country’s consumer price index, in the preparation of national accounts and to analyse poverty and hardship in communities. The Secretariat of the Pacific Commission (SPC) helps Pacific Island countries to conduct these surveys and maintains a database of reports of surveys carried out during the last decade.
These reports provide a rich source of data on poverty and hardship in the Pacific that can be used to inform policy and program design and help evaluate policies and institutions. In-depth analysis of the kind necessary to assess basic needs poverty lines has only been conducted sporadically throughout the Pacific, often with the assistance of the UNDP.
Filling in the gaps
While countries such as Tonga, Fiji and Samoa have had recent HIESs, all of which have provided valuable information on areas of critical need for poverty reduction, in other countries policymakers have been left trying to fill in gaps in data.
Papua New Guinea is one such example. While a household survey is currently being finalised, the last completed survey was in 1996. In order to estimate the level of poverty in 2004, the World Bank poverty assessment used a modelling approach. Understanding the method used in this exercise can help policymakers to interpret results and to reflect on the accuracy of these estimates.
In order to model the patterns and trends in poverty, the World Bank research team used data on the rate and sectoral pattern of output and employment growth since 1996 and combined this with information on the sectoral profile from the 1996 household survey (World Bank 2004 [pdf], p.3, p.6). Based on this, they estimated that the proportion of the population living below a basic needs poverty line had increased from 37.5% in 1996 to 54% in 2003. They also estimated a similar trend for the international $1 a day poverty line — an increase from 24% to 39.6% over the same period. The World Bank’s assessment of poverty in PNG in 2003 is arguably conservative, for a number of reasons outlined in the discussion paper.
The PNG government is currently completing the household survey for 2008-09. The sample frame for this survey mainly focuses on urban areas (to collect data to re-weight the CPI) rather than rural areas where poverty has traditionally been highest. The implication may be that it could be difficult to get disaggregation of inequality, say to the district level, limiting the usefulness of the survey for the design and evaluation of projects and policy interventions.
Policymakers could also benefit from even greater detail, for example, from highly disaggregated geographical data and poverty mapping, as well as sourcing local case studies to examine the root causes of poverty (such as the recently completed study of Yelia, PNG).
Conclusion
There will always be disagreement over the definitions of poverty in the Pacific, with some favouring narrow indicators such as hunger and others broader multidimensional determinations such as ‘access to opportunity’. There will also always be political sensitivity about the use of the term poverty in the region.
However, this should not detract from the importance of identifying the most financially disadvantaged households and further analysing their experience of living below a basic needs poverty line. Quality household income and expenditure surveys are essential for measurement of income poverty and sound progress is being made throughout the Pacific in bringing such surveys up to date. However, this improvement is not uniform — PNG is a stark illustration of that.
Analysts should also be making better use of other data — there is a relative underutilization of Demographic and Health Survey (DHS) data for development policy analysis and a lack of harmonization between HIESs and DHS. Given the small size of many Pacific countries, censuses could potentially do more of the work that surveys encompass in larger countries.
The discussion paper shows that there is considerable data on income poverty in the Pacific that can be used as the basis for public policy, and that even where there are gaps, there are options for addressing these through a range of techniques. If donors and countries are serious about the MDGs, then it is imperative that these knowledge gaps on income poverty are addressed.
Matt Morris is the Deputy Director of the Development Policy Centre. He is the author of Discussion Paper #9 ‘Measuring poverty in the Pacific’ [pdf].


Nice work.
I think the point about delving into HIES data is well made – alas if only statistics offices would release the full set of the data and not just PDF’s of the aggregates, then people outside of Government may have a shot at this.
In terms of indicators, I think it is worth tracking several and over time – or to put this another way there is merit in comparing HIES results over time. Some interesting ones are:
– Basic needs poverty;
– Basic needs nutrition – this is usually but not always part of the point above;
– Relative income distribution (usually Gini stuff);
– Relative income distribution within the country – a point you make very well in your paper and something SPC / AusAID could do with the GIS technology available; and
– Results relative to reasonable comparator countries (i.e. don’t compare Vanuatu with Singapore)
However, I think the real value in your piece is to highlight the excellent way the World Bank link the sectoral and HIES data. They did this in Vanuatu in 2004 and it remains in my mind one of the finest pieces of work I have seen by the Bank. I think though for those who have never seen the type of results this type of analysis can highlight it would have been good if your note had shown some of the results.
For example in Vanuatu we got some outstanding data on how people of different income groups educate their children – basically it showed that most of the kids in secondary came from a certain set of income quintile families etc (middle class and above). The picture for primary was similar and this enabled people to lobby more effectively for universal access to primary education. The information on health was also illuminating. I am hoping that somebody will perform the same exercise with the new HIES.
The only slight downside with these kinds of analyses, especially in our region, is that you have to make a few “heroic” assumptions from time to time to cater for the quality of data – but that is ok as long as those assumptions are made explicit.
We did similar work with Satish Chand when he did the ADB Pacific Island Economic Report back in 2001 I think it was – and last year we managed to take a time series look at some data using his base data set. So for example it was interesting to see the Gini coefficient change over time – showing an increase in inequality in the mid nineties and a decrease in the first part of this century.