
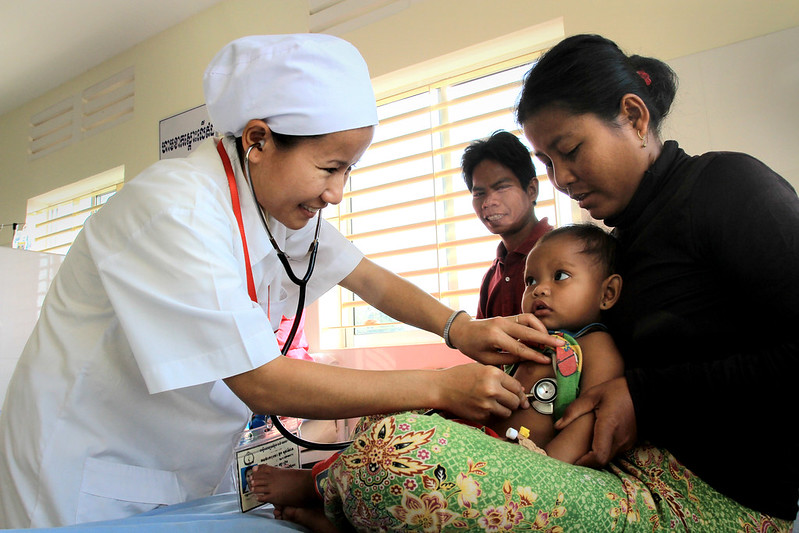
According to the World Health Organization, Universal Health Coverage (UHC) requires that all people receive the promotive, preventive, curative, rehabilitative, and palliative health services they need and can afford. The latest WHO and World Bank 2023 review Tracking Universal Health Coverage finds that “The world is off track to make significant progress towards UHC … by 2030 as improvements to health services coverage have stagnated since 2015, and the proportion of the population that faced catastrophic levels of out-of-pocket spending has increased”. This blog looks at service coverage in Asia (East and South) and the Pacific Islands Forum member countries, including Australia and New Zealand.
The UHC Service Coverage Index (SCI) tracks progress in 194 countries, measured by 14 key indicators under four headings: reproductive, maternal, newborn and child health; infectious diseases (such as TB and HIV/AIDS); non-communicable diseases (for example diabetes); and overall health access and capacity (with reference to indicators such as the number of health workers).
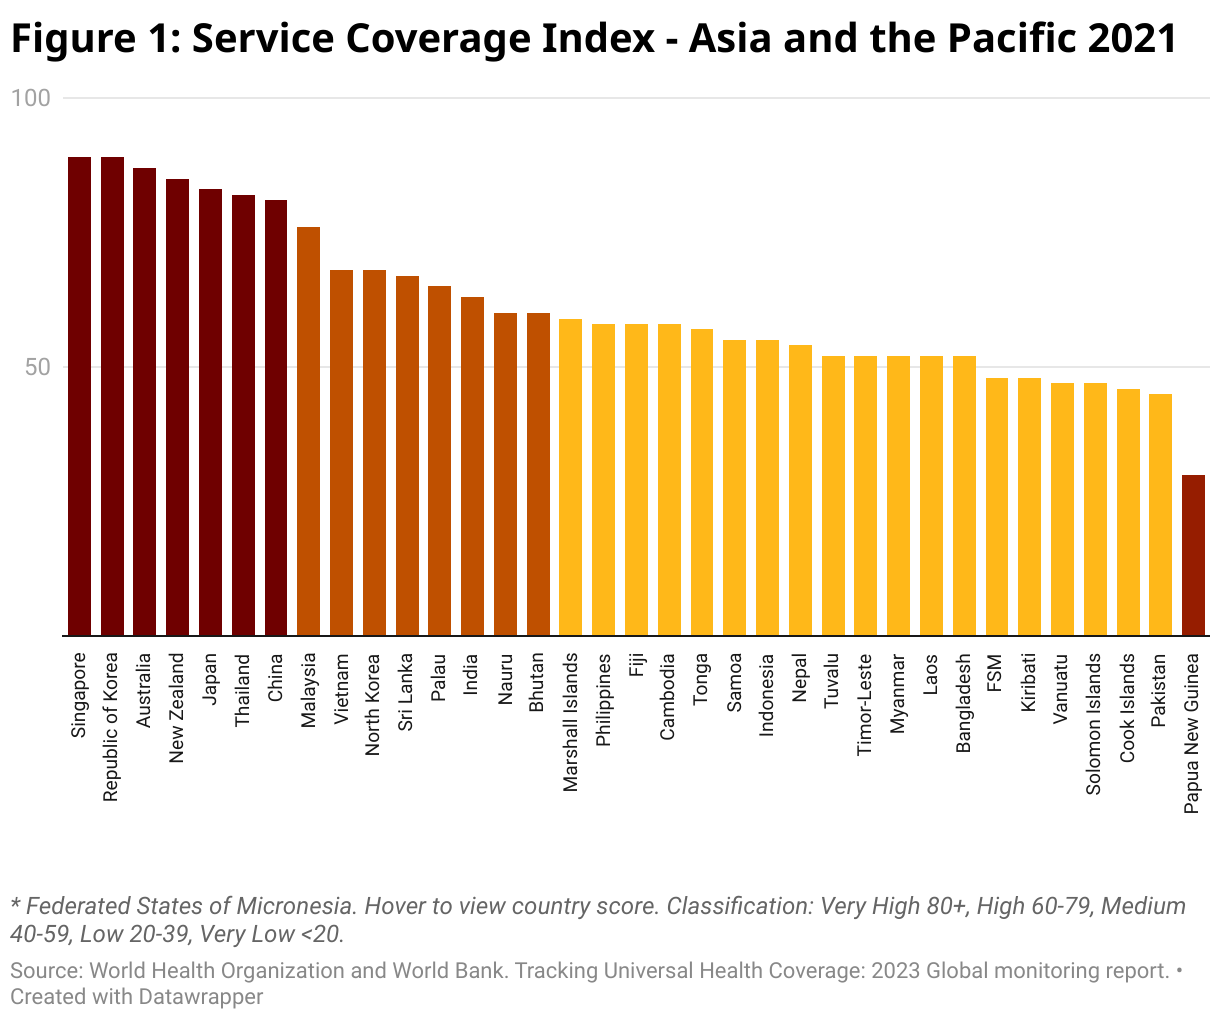
Figure 1 presents the SCI scores for the Asia-Pacific for 2021. Our region is home to neither the best performing country globally (Canada, with an SCI score of 91), nor the worst (Somalia, 27). However, the region traverses almost the entire range from Singapore (89) to Papua New Guinea (30). Overall, there are few surprises: the developed countries do best, then the developing countries of Asia, and then the Pacific countries, which occupy seven of the bottom ten slots.
Things become more interesting when we compare 2021 with 2000. Overall, despite the recent pandemic, it is a positive picture, with the average Asia-Pacific country improving its SCI by 20 percentage points. On average, the lower a country’s service coverage in 2000 the more it improved by 2021.
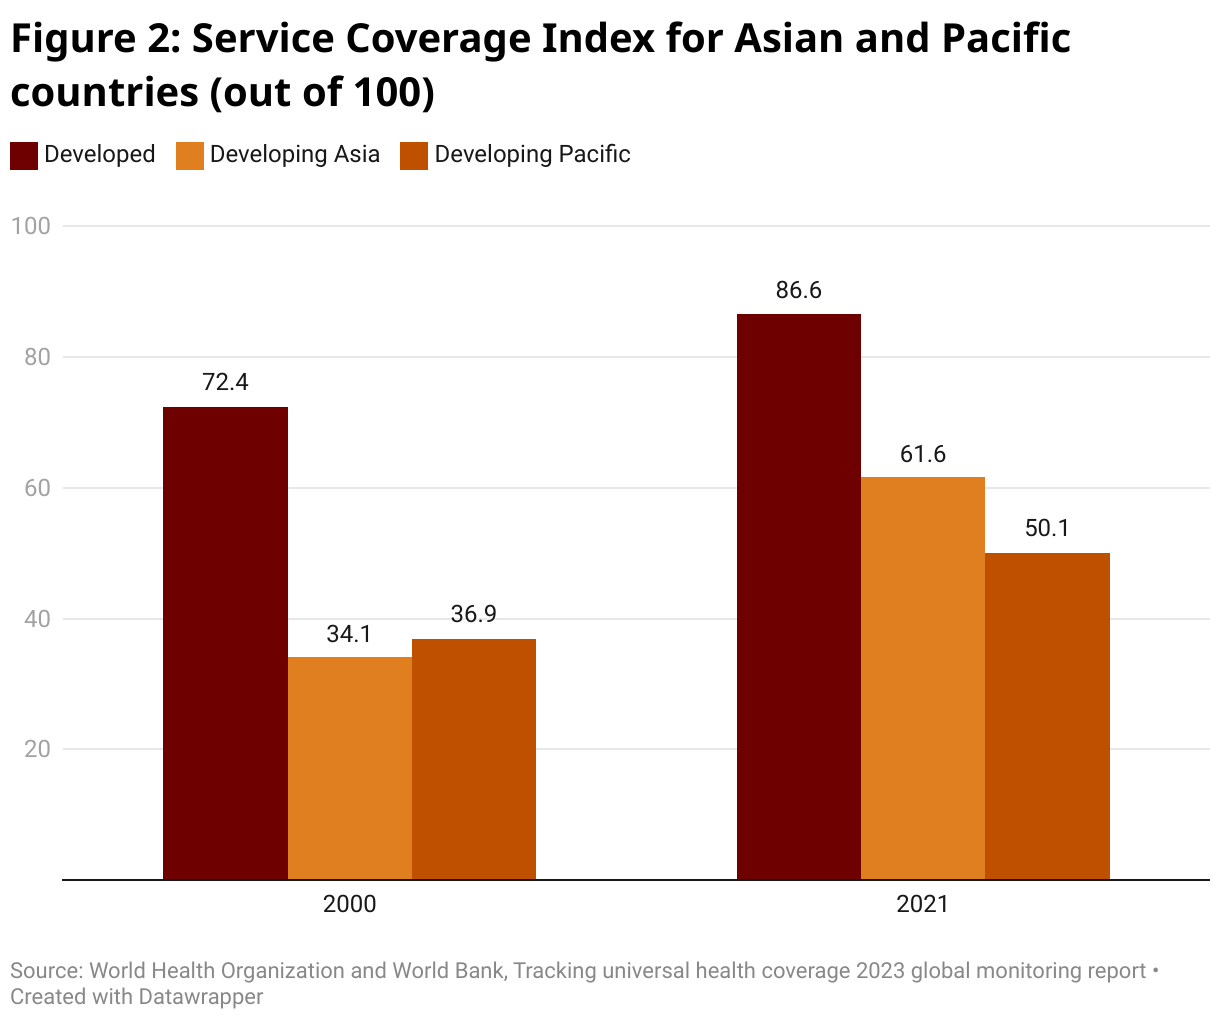
Asian countries improved a lot more than Pacific ones. As the next graph shows, in 2000 the average Asian country had slightly worse service coverage than the average Pacific island country (34 vs 37) with both groupings only about half of the developed country average (73). However, by 2021, the situation had been reversed. All regions improved their scores, and both Asia and the Pacific caught up to some extent with the developed countries. But the developing Asian countries have gone from being slightly behind to now well ahead of the developing Pacific countries (62 vs 50).
What explains this? There may be some data issues. Neither Cook Islands nor Niue showed much improvement at all. But all the citizens of these countries have New Zealand passports, and so can potentially benefit from New Zealand health care. Their low scores, whatever the reason, are probably misleading.
But there are also some real problems. Even if we take out Cook Islands and Niue, the Pacific still starts off ahead of Asia, and ends up behind it. PNG shows one of the slowest rates of progress of any country in the world. Only two countries – Chad and Somalia – now have lower service coverage scores than PNG. Only one Pacific country shows a service coverage improvement of more than 20 percentage points (Nauru) and none shows an improvement above the Asia developing country average of 25 percentage points. Cook Islands “graduated” from medium to high coverage over the period 2010 to 2019 but fell back to medium coverage in 2021. The scores for Fiji and for the Federated States of Micronesia have barely moved since 2015 and 2010 respectively.
The performance of some of the Asian countries is truly extraordinary. Seven have more than doubled their score. Nepal shows the biggest proportional increase, rocketing up from 20 to 54. Several Asian countries graduated from low service coverage in 2000 to high in 2021 (Bangladesh, Cambodia, China, India, Myanmar, Nepal and Timor-Leste) or very high (Thailand and Vietnam). Only one Pacific country (Nauru) made the transition from low to high service coverage over the same period.
Why the Pacific has been left behind is an important question. An examination of Annex 2 of the report reveals the specific achievements – and shortcomings – relating to service coverage in the region. Stepping back, one obvious difference between the two regions over this period is in relation to economic growth. The much faster economic growth that Asia has experienced has meant more resources for both households and governments to put into health care.
Whatever the reason, the slow improvements in health service coverage evident in the Pacific over the last two decades are a source of real concern. We hope they receive the attention they deserve.
Correction 18/1: Figure 2 has been corrected to label Developing Asia for the middle column and Developing Pacific for the third column. It was erroneously labelled in the original.


Hello Ian and Stephen. With reference to the histogram, is that Ware or Angel Falls between Pakistan and PNG. And for that matter Vanuatu, Solomon Is. and PNG. In practical terms it may as well be Angel Falls.
The graphic should grab the attention of aid planners. PNG is the population behemoth in the Pacific region and the graphic indicates UHC is around thirty percent. If the true extent of the UHC definition were applied, real coverage would probably be less than twenty percent.
The mounting frustration of people all over PNG at the lack of opportunity and failure of successive governments to deliver even the most basic services is building like a tsunami. The recent riots in Port Moresby and Lae were symptomatic of a lack of UHC and other problems as well. Surely, this in the largest recipient of Australian aid should tell us something.
For almost fifty years Australian assistance has focussed on “strengthening and capacity building” the systems. A system that has failed its customers most noticeably from district level down. Why?
A reflection generally prompts a response about a lack of funds for infrastructure assets, transport and human resources – all true. But if by some magic these deficiencies evaporated today, I have a feeling little would change. Because the “system” was and remains culturally inappropriate at the community interface.
It has always struck me how vociferous rural communities get when the topic of basic services is raised. Not just about the absence of health or education but from their perspective, how inappropriate the public servants are.
To paraphrase their message, “don’t send someone we don’t know or trust to do things on our land, to our children, our mothers, our babies. Give our young people the training we need to do these things for ourselves.” This message has one thing in common with UHC: the U part.
So, in light of the riots and chaos that should act as a warning and a UHC statistic that flags an ongoing and unnecessary tragedy on Australia’s doorstep, can we step back from the “same ol same ol”, listen to what eighty five percent of PNG’s population tell us (which unsurprisingly is different from what you hear in Waigani) and focus more attention on that.