Each northern spring, the OECD releases data on Official Development Assistance (ODA) flows from the members of its Development Assistance Committee (DAC) in the most recent calendar year, in this case 2016. Data released yesterday are preliminary but, based on past experience, won’t change much when published in final form in December 2017.
In this brief post, I generally won’t repeat what’s in the OECD’s own press release, which includes links to a useful narrative summary, the underlying numbers and interactive graphics. I will highlight, though, that aid from OECD donor countries increased by 8.9% in real terms in 2016—the fourth consecutive real annual increase—to reach a new high of US$143 billion. This was equivalent to 0.32% of donors’ collective Gross National Income (GNI), the highest ratio achieved since 2005.
The purpose of the present post is rather to examine, taking into account the new data, how Australia stands in relation to its peers over time with respect to aid volume and aid effort, where the latter is measured in terms of ODA as a proportion of GNI. The general assumption had been that in 2016 Australia would rank lower on both of these counts than it did in 2015. That’s because 2016 was the first calendar year in which it would be possible to perceive the full-year effect of the A$1 billion aid cut imposed in the 2015 budget.
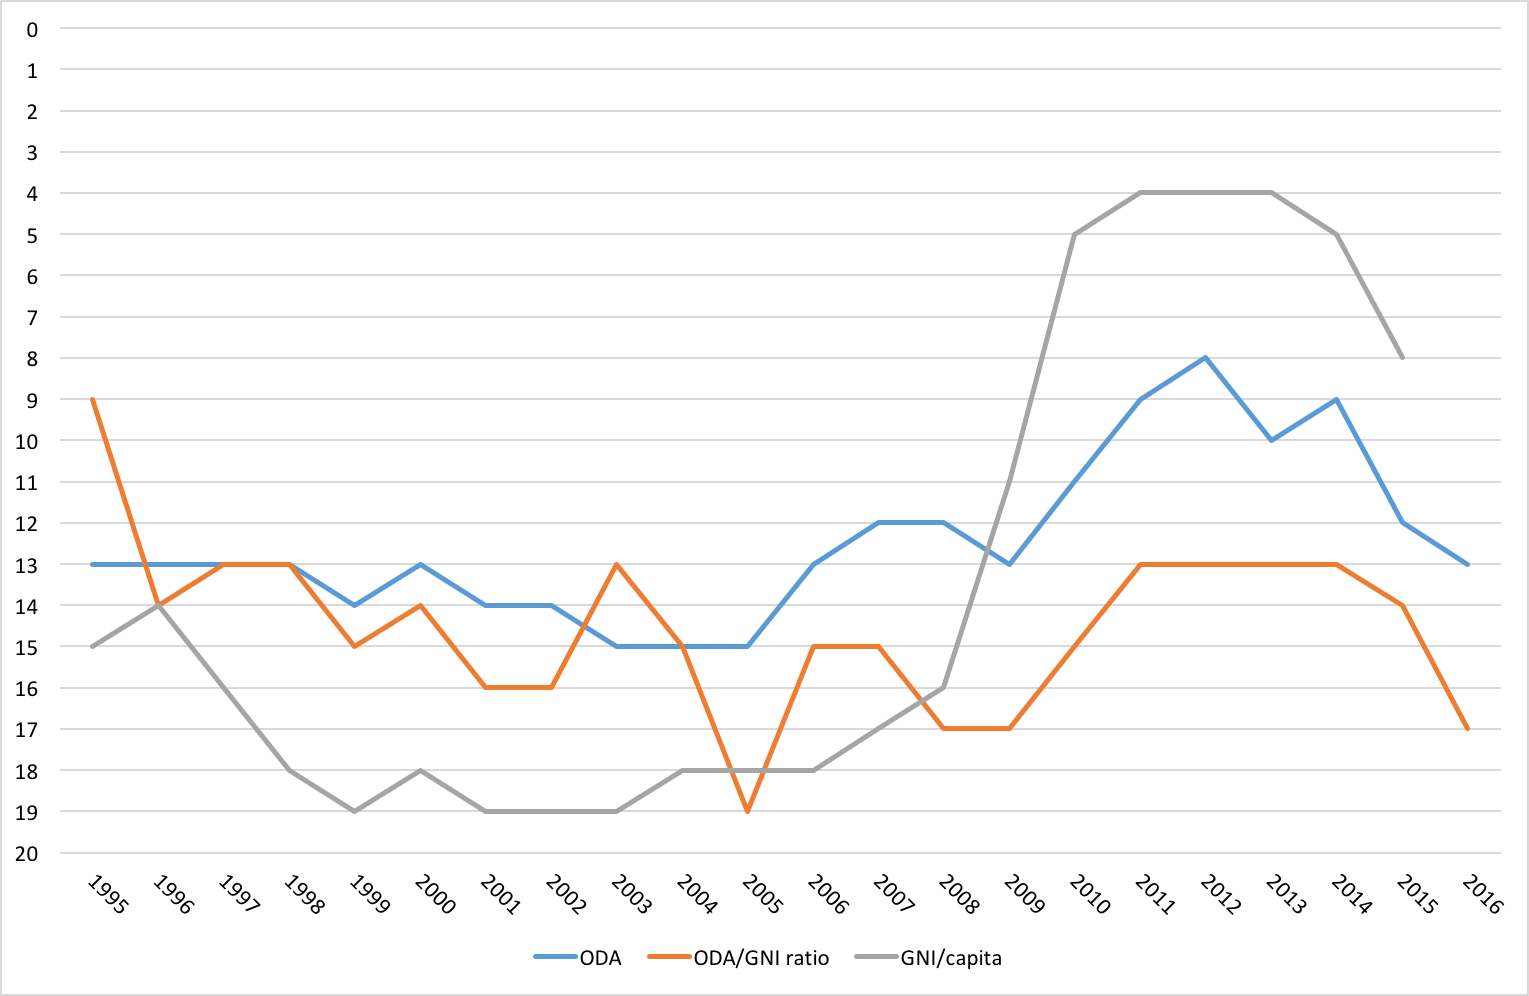
The general assumption wasn’t wrong. According to the OECD’s new data, Australian aid fell by 12.7% in real terms in 2016, to US$3 billion. This was equivalent to 0.25% of Australia’s GNI, lower than at any time since the Howard government began to increase aid from 2005 (though not yet as low as the 0.22% estimated for the 2016-17 fiscal year). As a result, Australia was overtaken by Spain on aid volume, and by Canada, Spain and Italy on aid effort. Australia therefore dropped from 12th to 13th with respect to aid volume and from 14th to 17th with respect to aid effort.[1]
Figure 1 places these ranking changes in a recent-historical perspective.
Figure 1: Australia’s ranking among OECD donor countries over time
 Source (for both figures): OECD aid statistics and author calculations
As can be seen, the 2016 global aid outcome lowers Australia’s effort ranking to levels last seen in 2008 and 2009. Only in one year, 2005, has our effort ranked lower. Our volume ranking also falls to a level last seen in 2009, though not quite yet to the levels seen in the 2003-05 period.
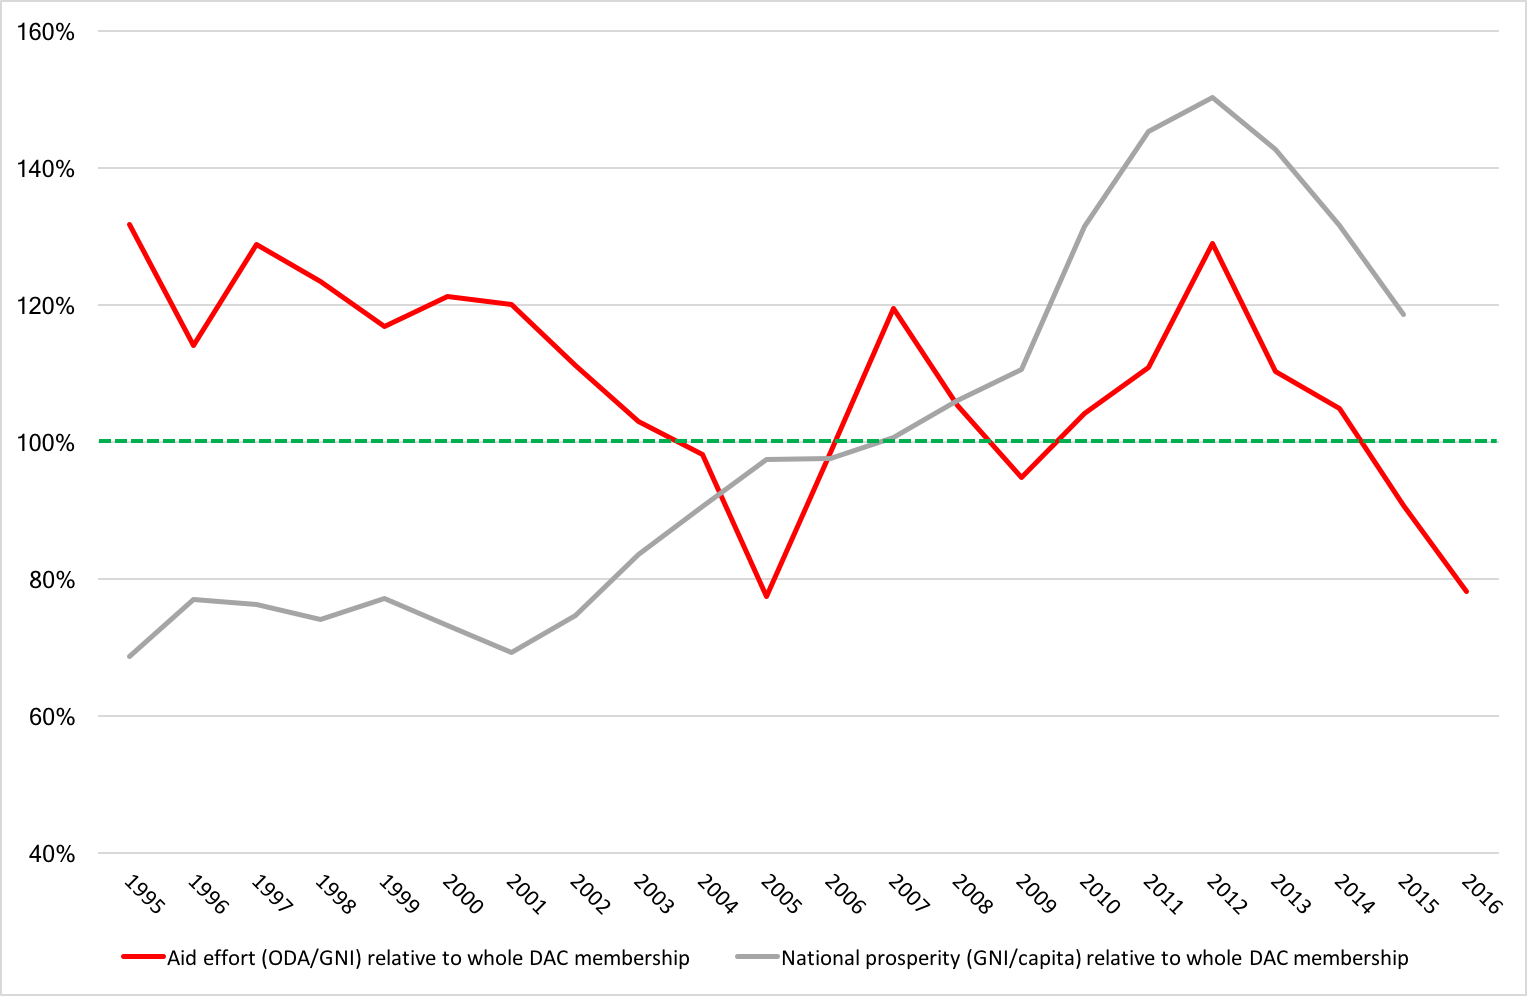
Because total DAC aid increased not only in real dollar terms but also as a proportion of the DAC’s collective GNI in 2016, simple rankings don’t tell the whole story. It’s useful also to consider how Australia’s aid effort compares with that of the collective over time, as in Figure 2.
Figure 2: Australia’s aid effort (and prosperity) in the OECD context
Australia’s ODA/GNI ratio in 2016 stood at 78% of the collective ratio, taking us back to 2005, just before Howard’s change of heart on aid. In that year, as in 2016, DAC donors provided aid equal to 0.32% of their collective GNI while Australia provided aid equal to only 0.25% of its GNI.
Data on 2017 aid flows won’t bloom until April 2017 and, as the 2016 case shows, prediction is tricky when there are so many variables. However, holding aid volume and ODA/GNI ratios constant for all other donors, and assuming that Australia’s 2017 federal budget will again allocate around A$3.8 billion to the aid program, Australia would likely hold on to its 13th position in the aid volume stakes in 2017 while falling from 17th to 19th in the ODA/GNI stakes.
You can see more on how Australia compares to other OECD DAC countries on the Comparison page of the Australian Aid Tracker, which has been updated with this new data.
[1] I had guessed, in my recent contribution to the Development Policy Centre’s submission to the government’s foreign policy White Paper process, that in 2016 Australia would hold on to its 12th position in the volume stakes but drop from 14th to 16th position in the effort stakes. This guess was based, as it had to be, on the assumption that aid from all other donors would be as it was in 2015. In the event, movement in the rest of the field delivered a slightly worse outcome for Australia.


