Over the years psephologists and pundits have made use of all manner of different approaches to predict election outcomes. Polls are, of course, the most obvious one and — notwithstanding the occasional high-profile failures — generally work quite well. Another approach, often referred to as the Fundamentals Approach, involves taking key variables, often associated with economic performance, to estimate electoral outcomes. In some countries this has worked surprisingly well.
Neither of these two approaches is feasible in Papua New Guinea though. Accurate polling on a large enough scale to predict individual electorate outcomes would be astronomically expensive. One of us (Terence) has tried some very basic fundamentals-style modelling for PNG in the past, but to no avail. Available data are all at the national level, but most electoral contests are determined by local factors.
There is an alternative approach though. One discovered around 45 years ago by Australian political scientist David Hegarty, and one which we’ve referred to as the Hegarty Law or Hegarty Rule in previous work. After studying early election outcomes in PNG, Hegarty discovered a relationship between candidate numbers and the probability that incumbents would win or lose their seats. In electorates with more candidates, incumbents were more likely to lose. In discussion papers, blog posts and journal articles, we have looked into the relationship, studying it a number of different ways, refining our approach as we’ve gone along.
In our recently released discussion paper on the 2022 election in PNG, along with many other topics, we revisited the Hegarty Rule, improving on the regressions we have used in the past. When we did this, we found a clear relationship over time between changes in candidate numbers and whether incumbents won their seats back or not. The relationship isn’t perfect: sometimes candidate numbers shot up and incumbents still won their seats back, but a correlation is there in the data.
Identifying an enduring historical relationship is one thing, and of interest to social scientists, but it would be more interesting still if the relationship could be used to predict election outcomes in advance.
One of us — Terence — had thought about doing this prior to both the 2017 and 2022 elections but — thanks to the relatively short period of time between getting candidate numbers and the elections, his own uncertainty about the best approach to use, and the other distractions of his day job — he never actually got round to doing so.
So, in our new discussion paper, we did the next best thing: we used a model based on the average relationship observed between candidate number changes and outcomes in earlier elections to see whether we were able to “predict” whether incumbents would win their seats back in the 2017 and 2022 elections. (We also included several other variables in the test — see the discussion paper.) This was too late, of course, to work out who would win, but because all the data in the model came from elections prior to the ones we were testing it on, in practice it was the same test.
How did our model go? How well would it have predicted the outcomes seat by seat in the 2017 and 2022 elections had it been run prior to the elections? The chart below shows this. It plots the percentage of seats that our model called correctly in each of the two elections.
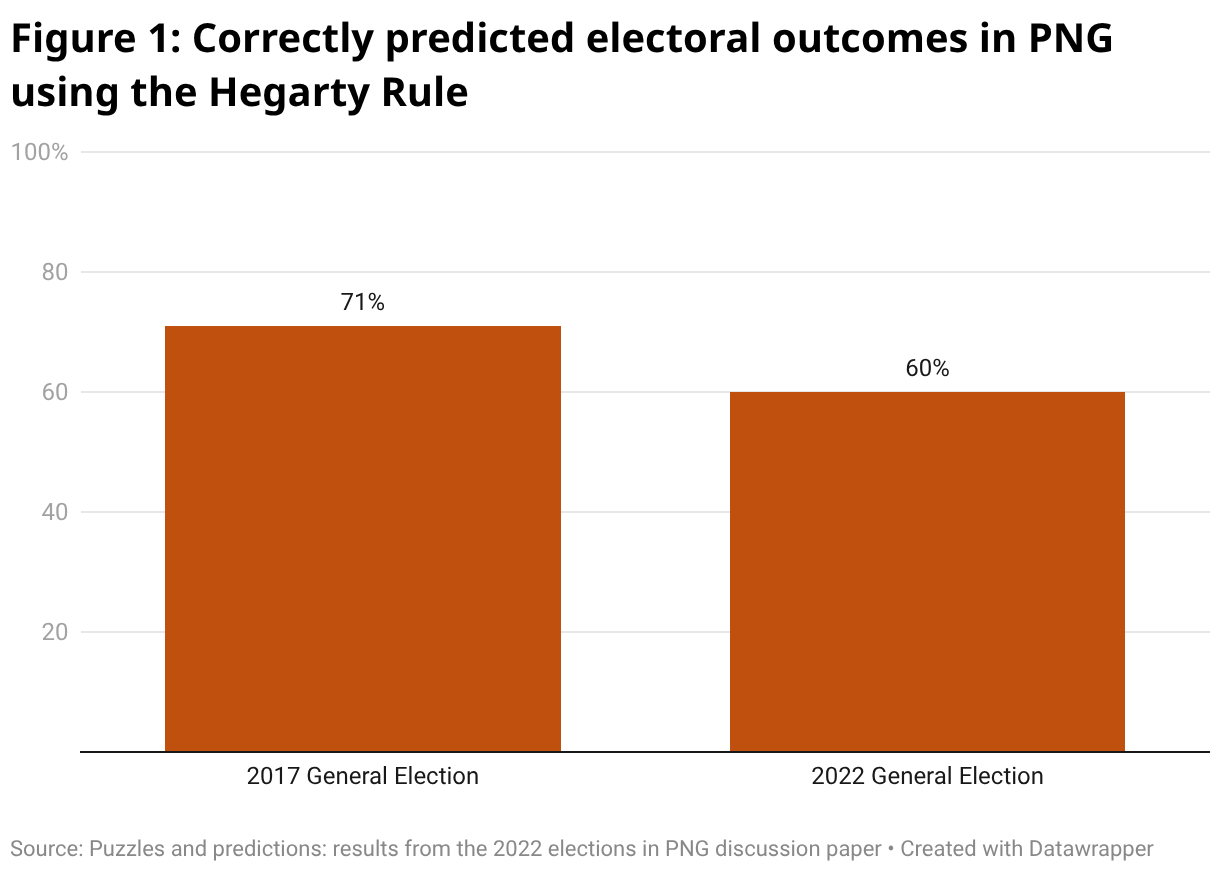
In 2017, the model predicted the correct result 71% of the time. In 2022, it predicted the correct results 60% of the time. These numbers sound pretty impressive. However, remember that you would get the result right in 50% of electorates simply by tossing a coin.
Nevertheless, in the messy world of social science, anything that performs discernibly better than a random guess is onto something. And our model did well enough to raise some interesting questions. Why do candidate numbers fluctuate in a way that reflects results? Two quite different explanations have been given for this in the past. The first is that aspiring politicians behave rationally and decide to stand when they know that, for whatever reason, the incumbent is weak. The second is based on emotion: when MPs perform poorly people get frustrated and this frustration drives more candidates to stand. Learning more about which of these mechanisms is prevalent would be very useful. Another question is why the model worked so much better in 2017 than in 2022? (We offer some answers to the latter question in the paper. Spoiler alert, part of the answer is to do with political parties.)
Outside the carefully caveated, chart-strewn world of academia, there is also a more practical question: could anyone make use of the Hegarty Rule to guide their own actions around election time?
Candidates clearly can’t — by the time any predictions would be possible, they will have already made the decision about whether to stand or not. Voters probably shouldn’t: the model’s not perfect and voters wanting to guesstimate who will win would be better off making use of their own local knowledge. What about diplomats? It would be helpful, we presume, if they could confidently predict whether they’ll ever have to deal with Politician X again. Sadly, at this point in time, while the model’s predictions might afford some guidance as to whether the next parliament will be full of fresh-faced newbies or canny old hands, the predictions aren’t accurate enough to say for certain whether Politician X will be heading for the dustbin of history.
At least, that’s the case at present. But in the future, it might well be possible to build on the existing model to develop more powerful diagnostic tools. For now though, in a country devoid of polls, and where other approaches don’t seem to work, the relationship between candidate numbers and election outcomes is something. And it is intriguing, even if you wouldn’t want to bet your house on its predictions.
Read the full discussion paper.