
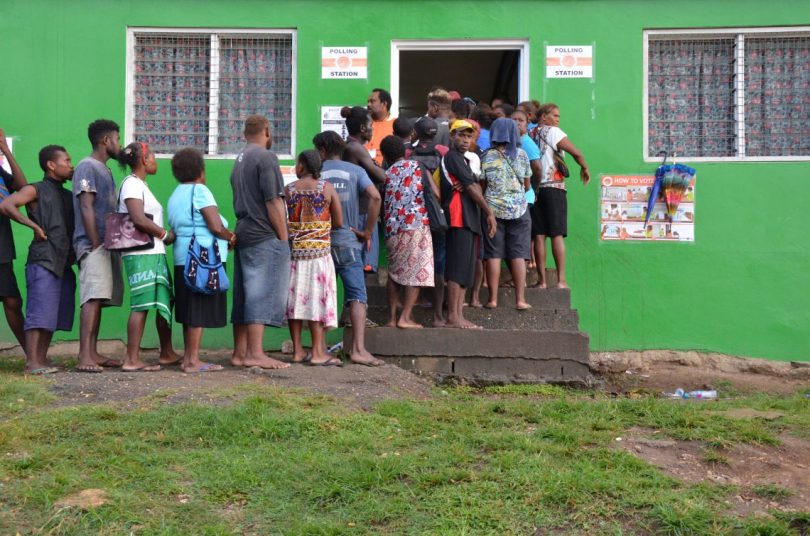
Constituency development funds (CDFs) are contentious in Solomon Islands. They’re a significant slice of government spending (10-15 per cent) and can be used largely free of restriction by MPs in their electorates. In theory, they allow MPs to support communities when the state is not up to the task. But the funds come with much potential for misuse.
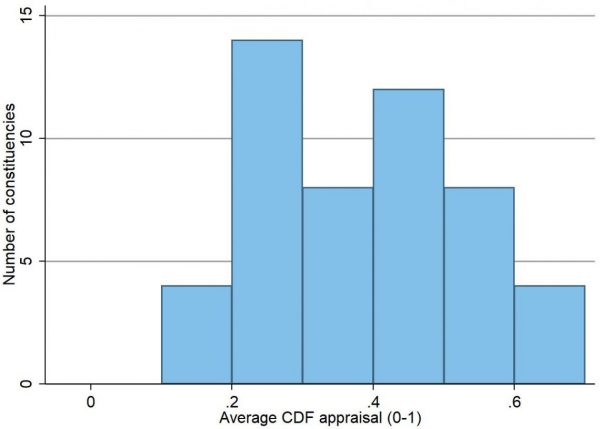
In late July, the Island Sun published an article on a recent evaluation of CDFs. The evaluation was run by the Solomon Islands government in 2018 and funded by the European Union. Amongst much else, the evaluation scored constituencies based on how well their MP used the CDF between 2014 and 2018. The scores came from impressive work by the evaluation team. They visited every constituency in the country and appear to have randomly sampled communities within constituencies. Constituency scores were derived from the views of people spoken to in communities. Constituencies were scored on several indicators and these were averaged to produce an overall score. The Sun’s article included a table of overall scores. The chart below is a histogram of constituencies’ scores. Scores could range from zero to one, but in reality the lowest score was 0.1 and the highest just over 0.6. The mean and median scores were 0.38. Based on the scores, the evaluation rightly concluded that CDFs aren’t typically being managed well.
Histogram of CDF performance scores
That was the overall conclusion. When I saw the Sun’s article I decided to test something else. I wanted to know whether there was a relationship between quality of CDF use and whether MPs did well in the 2019 elections. Were voters more inclined to vote for MPs who used their CDFs well?
To test this I created a measure of incumbent success in the 2019 elections. If an incumbent won their seat back in 2019, this was their vote share divided by the vote share of the candidate who came second. If the incumbent lost, the score was the incumbent’s vote share divided by that of the newly elected MP. (Enthusiasts note: my results hold if I use a binary incumbent won/lost variable and logistic regressions.)
This scatter plot shows what I found. The Y-axis is my measure of incumbent success. The X-axis is the overall CDF performance appraisal. Each dot is a constituency. The large outlier, who laid waste to his opposition, is Namson Tran in West Honiara. (Excluding West Honiara from my analysis does not change my main findings.)
Scatter plot of CDF appraisal verses incumbent success

If you stare hard at the chart you can see that the line of best fit slopes up ever so slightly, but the relationship between CDF appraisals and incumbent success scores is not statistically significant. MPs whose CDF use was appraised more positively by people surveyed in their electorates did not perform better in the 2019 elections. (This remains true if I add controls for constituency population and MP winning margin in 2014.)
The finding is puzzling. CDFs afford MPs a lot of money. And politics in Solomon Islands is strongly clientelist. People don’t usually vote on national issues. Spending constituency funds well ought to confer an electoral advantage.
There is a potential, not particularly interesting, explanation for the puzzle: it is possible the report’s data are flawed. I’ve read the report’s methodology. There are certainly issues, but they’re probably not so bad as to hide a real relationship if it existed.
There is also an alternative explanation. This is that most MPs don’t spend CDFs on everyone in their electorate. They usually focus foremost on their supporters and maybe potential supporters. This is an electorally rational strategy. Albeit one that limits the development benefits of CDFs. The teams gathering data for the evaluation, however, didn’t focus just on MPs’ supporters – they spread their attention around constituencies, speaking to people who MPs aided as well as those who they did nothing for. Hence the mixed overall assessments. And hence the lack of a clear relationship – the CDF appraisals came from randomly selected communities around constituencies. MPs’ electoral performance, on the other hand, stems from targeted spending.
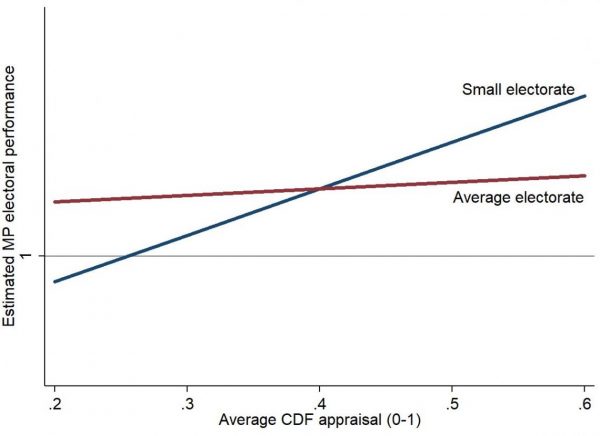
There’s a means of testing this explanation – albeit an imperfect one. The test is to see whether there is a positive relationship between CDF appraisals and MP success in smaller constituencies but not in larger ones. (Constituency populations vary a lot.) The probability that communities sampled in the evaluation included MPs’ supporters will be higher in smaller constituencies, and this ought to affect the relationship between CDF appraisals and electoral performance. The chart below shows what I found. It plots the average relationship between CDF appraisals and electoral performance for small electorates, and it plots the relationship for electorates of about average size. As you can see, there’s a clear relationship for smaller electorates but little for average sized ones. (Technically the chart comes from interacting voting aged population and CDF appraisals in a regression in which MPs’ electoral success scores are the dependent variable. You can see regression results here.)
Relationship between CDF appraisals and electoral performance – small and average constituencies
This isn’t definitive evidence, but it is suggestive. Unfortunately, using CDFs to deliver assistance to broad shares of electorates in Solomon Islands is not usually the most electorally effective means of using the funds. Or to put it another way, the desire to be re-elected is not incentivising MPs to spend CDFs well.
Thanks for your analysis, Terence. It seems that a core issue is low transparency and accountability by MPs regarding use of CDFs for the common good and wellbeing of the constituency. Perhaps in smaller constituencies it is harder for incumbents to disguise biases in spending, whereas in average/larger constituencies this is more possible?
Hi Bill,
Thank you — that’s a fascinating comment. Like you, I imagine that knowledge about spending is much greater in Malaita Outer Islands than it is in Central Honiara, simply because there are fewer people for knowledge to flow through.
Thinking quickly off the top of my head — it could explain the effect. Also, because CDFs are the same amount, regardless of constituency size, in smaller constituencies maybe it’s simply easier for MPs to spend well on everyone (if they’re inclined to spend well).
Thanks again
Terence
Really interesting to hear of this evaluation and your analysis. CDFs in the Pacific are unfortunately probably here to stay and as I understand among the largest in the world. From many years working in PNG, I am convinced that supporting community monitoring of the CDFs through social accountability can contribute to improving CDF accountability and transparency. As a global social accountability adviser and previously a DFAT program adviser, I have been promoting proven social accountability approaches to DFAT in the Pacific since 2008. World Vision are currently working on this with Oxfam in Solomons at the moment. But our experience from Africa (Kenya in particular) suggests that social accountability focussed on informing communities about the CDFs and facilitating greater access to lobbying MPs on their use or usually misuse can lead to greater accountability in use of the funds. I am not sure where PGF are at these days, but I have been lobbying to them for many years to consider existing approaches we have successfully promoted in Madang PNG and got greater service responsiveness. CARE also use these approaches though not so much in the Pacific until recent times as I understand, but we have a global partnership to leverage our joint impact on this work. World Vision has the greatest global social accountability footprint with more than 600 programs in more than 48 countries and studies from Oxford, Columbia, John Hopkins (including RCTs) to validate the impact of this work. This is now supported by a 2016 DFID macro evaluation which showed this work ‘almost always’ impacted service delivery, and a new 3IE systematic review in May this year also validating effect on service delivery. The jury is still out on demonstrating impact on longer causal chains to development outcomes, but in the Pacific any improvement in service delivery is desperately needed.
Hi Sue,
Thank you for your interesting comment. Like you I’m a fan of social accountability approaches where they work.
It would be fascinating to trial something of this nature in Solomons. My only reason for thinking this wouldn’t work is that successful MPs seem already to be very accountable (at least in my experience) but only to their supporters. The challenge would be to broaden the sphere of accountability to everyone in the electorate. I’d like to think it could be done. It would certainly be a good area for impact evaluations.
Thanks again for your comment.
Terence
Hi Terence,
The CDF history in the Solomon Islands is as old as the country attaining self rule. Prior to that, service delivery was through traditional mechanisms or vested with sector departments. By 2006, the paradigm shifted to a model that elected representatives know better to their constituents and so it was adopted with the establishment of Ministry of Rural Development in 2007. Other Pacific nations were probably ahead by then, for instance PNG with the Slash Fund, and so over time it became apparently that getting assistance is tied to voting in your favored candidate. The existence of vulnerable groups much in need of government services in health and education are still isolated. The SISAC is currently supported by European funding to “improve social accountability in Solomon Islands” and quite optimistic to have establish the foundation for the pacific region through this project.
SISAC is a coalition of 10 national CSOs have started with institutional strengthening. It is exploring during its duration to reach rural communities and will do so through partnership with state institutions/ministries. It is taking up the challenge as a national CSO comprising registered civil society groups and non-government organisations to promote social accountability in Solomon Islands. It will cover the CDF, Health, Education and Youth for a start, focusing of budget transparency and accountability. It is up to the challenge, but counting on the nationally sourced expertise and learning from across the globe.
Thanks for this information
Simon
Hi Simon,
Thank you very much for the information — it’s really interesting to know about.
Terence
Hi Sue,
Yes there are elements which favor CDFs to stay in the Solomon Islands or other pacific nations, and apparently the foremost is help that is available with voting. While many more vulnerable groups exist, government programs are designed in isolation, so the intervention is a mismatch to the need. The Solomon Islands Social Accountability Coalition (SISAC) is currently supported by European funding to “improve social accountability in Solomon Islands” and quite optimistic to have establish the foundation for the Pacific region through this project.
Hi Simon, are you working with SISAC? Be interested to take this conversation offline. I am suzanne_cant@wvi.org. Cheers Sue