In our previous blog, we showed how remittance costs in Tonga could be much lower than the average calculated by Remittance Prices Worldwide (RPW) if households and workers chose low-cost Remittance Service Providers (RSPs). In this blog, we use the Pacific Labour Mobility Survey (PLMS) to show that households and workers actually tend to choose high-cost RSPs, with the result that realised remittance costs remain high.
The PLMS asks workers in Australia and New Zealand and households in the Pacific about the main remittance channels and RSPs they use. The household survey covers six types of remittance channel: online transfer through banks; online transfer through Money Transfer Operators (MTOs) such as Western Union and Moneygram; over-the-counter transfer through MTOs; mobile wallets; through friends; and other. The worker survey has five categories: online transfer (through both banks and MTOs); over-the-counter transfer; mobile wallet; through friends; and other.
Table 1 reports the main remittance channels used by Tongan households. 47.6% used over-the-counter transfers through MTOs. Just over one-third used online transfers through MTOs, followed by online transfers through banks with 12.4%. Mobile wallets had a relatively small share at 5.7%. Only one household said they used informal transfers through friends. (It is likely pandemic travel restrictions prevented migrants from carrying cash home by hand, as they tended to stay abroad.)

The same question from the worker survey, which draws from only some of the same households, gives a slightly higher share for online transfers. Table 2 shows that 69.9% of Tongan temporary migrants sent remittances by online transfer through banks or MTOs, while 25.6% used over-the-counter transfers. Mobile wallets remained relatively unpopular at 1.7%. The number of temporary migrants who sent money through friends was higher (at 2.5%) because the worker survey was conducted after border restrictions eased.

Combining the PLMS and the new market audit data we presented in the previous blog reveals that most Tongan households and migrants choose higher-cost RSPs. This leads to an average realised remittance cost, among workers surveyed who also use the RSPs we audited, of around 6.4%. For PALM workers the costs are slightly higher at 9.5% compared to RSE workers’ 6.27%.
Figure 1 illustrates the main RSPs in the Australia- and New Zealand-Tonga corridors used by households and workers. More than 20 RSPs are used by Tongan households and workers, but three are popular: Moneygram, Western Union, and Ave Pa’anga Pau. In the Australia-Tonga corridor, Moneygram had a dominant share of 54.29%, followed by Western Union with 19.9%. Ave Pa’anga Pau, a relatively new MTO established by the Tonga Development Bank to lower remittance costs, came in third at 7.8%. These shares were relatively consistent in the worker survey.
Figure 1: The use of RSPs by Tongan households and workers (%)
Source: Created by the authors from PLMS data.
Despite Moneygram and Western Union having a dominant market share, cash transfers through Moneygram, as well as both cash and online transfers through Western Union, are considerably more expensive than through low-cost RSPs. Table 3 shows that cash transfers through Moneygram cost 5.4%. Although Moneygram also offers lower-cost online transfers, 44.4%of households using Moneygram received money in cash (Figure A1 in online appendix). For Western Union, cash transfers cost 8.2% and online transfers 7.4%, much more than the cheapest RSP’s 1.8%.

In the New Zealand-Tonga corridor, the lowest-cost RSP Ave Pa’anga Pau was also popular with a more than 30% market share. Between 12.3% and one-third of survey respondents used Moneygram, while between 15.2% and 21.3% used Western Union. Western Union and Moneygram users paid remittance costs up to six percentage points higher than the cheapest option (Table 4).

Given the relatively higher market share of the higher-cost RSPs, the obvious question is: why do people choose them?
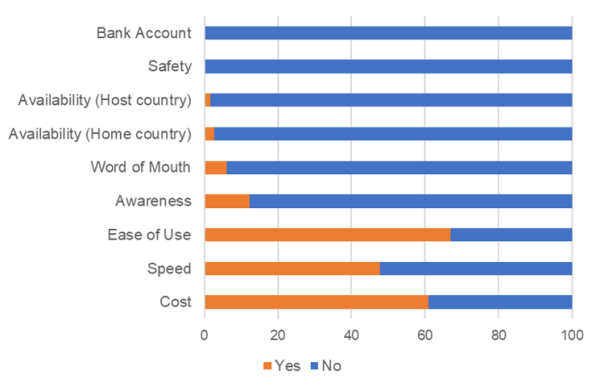
Figure 2 shows that 79.9% of Moneygram and Western Union users chose their remittance channels because of ease of use, followed by cost (38.0%), and speed (34.2%). It is reasonable that people do not use Ria much in the Australia-Tonga corridor because it has only one agent in Tongatapu and remains relatively new. Figure 3 shows that the users of Ave Pa’anga Pau, by contrast, paid much more attention to cost (60.9%). Those who keep using Moneygram and Western Union presumably stick with them because they accord strong priority to factors other than cost.
Figure 2: The reason why Tongan migrants who use Western Union and Moneygram choose remittance channels (%)
 Source: Created by the authors from PLMS data.
Figure 3: The reason why Tongan migrants who use Ave Pa’anga Pau choose remittance channels (%)
 Source: Created by the authors from PLMS data.
Nevertheless, we found a silver lining.
RSP choice appears to be naturally shifting to lower-cost RSPs over time. Western Union’s market share among SWP workers declined from around 96% in 2017 to 17% in 2023 (see page 38). The share among RSE workers fell from 60% in 2010 to 15% in 2023 (see Table A9 in the online appendices). New lower-cost RSPs like Ave Pa’anga Pau and KlickEx have quickly grown in popularity among temporary migrant workers, accounting for 14.5% of all surveyed households, higher than 10% in the Australia-Tonga corridor and 37% in the New Zealand-Tonga corridor (see Table A2-6 in online appendix).
An earlier blog and recent brief discuss macro-level constraints on remittance cost reduction, like financial capability and price transparency regulations. We have now added workers and households to this discussion: much lower remittance costs could be realised simply by shifting remitter behavior. But how much would Tonga gain? What prevents people from switching to lower-cost options? We will address these questions in the final blog of this series.
This blog is the second in a three-part blog series.


thank you for the survey and your blog.