At the Development Policy Centre, we have been tracking the fundraising efforts of Australian development NGOs since our first blog on the subject in 2013. The measure we have always used, and which we update annually on the Aid Tracker, is funds raised from the community: public donations and bequests. That is an excellent measure of public support for the sector. But it is not a good measure of the funds NGOs have to send overseas, or to run their operations in Australia.
Fundraising is an expensive business. One has to spend money to raise it. To measure the extent to which NGOs are able to channel public support into development, we need to look at funds raised minus fundraising expenditure – a figure we have termed ‘net public donations’.
Our development NGO database also tells us how much NGOs spend in order to raise funds. From this, we can estimate not just gross but net public donations. We have to make a few assumptions, detailed at the bottom of this blog, but we think the numbers are quite accurate.
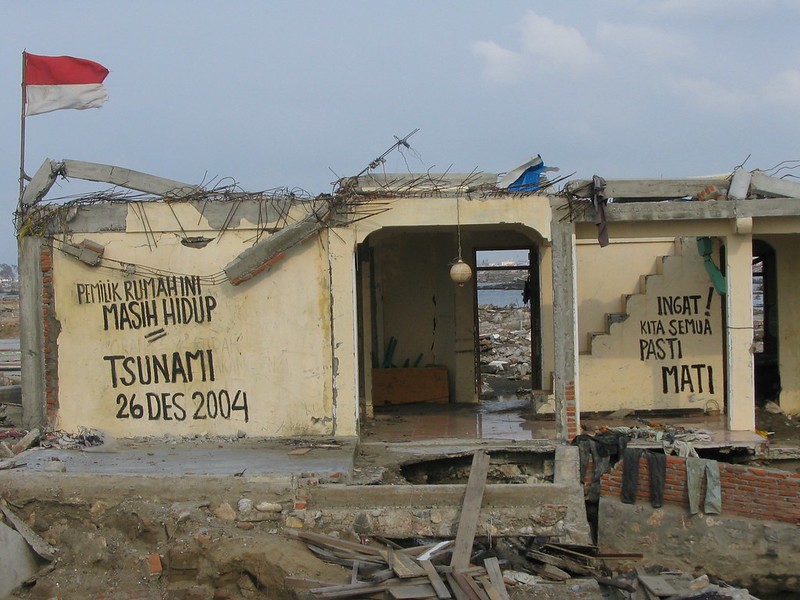
The figure below shows the key results. (All the numbers are adjusted for inflation.) The blue line is one we have long showed on our Aid Tracker, namely gross public donations, and the orange one is net public donations. Both lines show a huge leap in 2004-05 in response to the Asian Tsunami, and then a partial fall, followed by a modest increase till about 2014-15, and a decline thereafter. Gross donations (blue) in 2018-19 are about the same as they were in 2006-07. Net donations (orange, dashed) are back at 2005-06 levels.
Gross and net donations to Australian development NGOs
NGOs are spending much more on fundraising. In 2003, the first year for which we have data, and adjusting for inflation, we estimate that development NGOs spent $102 million on fundraising. By just over a decade later, in 2014-15, the amount had doubled to $212 million.
But it is getting harder to raise funds. In the years after the Asian Tsunami, NGOs raised up to $7 for each $1 spent. That ratio (a ratio of fundraising efficiency) is now down to 5, its pre-Tsunami level.
Fundraising costs and efficiency
2014-15 was in fact the year in which fundraising expenditure peaked. Development NGOs have since put the brakes on. Spending $1 to raise $5 seems reasonable, but you’ve got to be confident that you are going to get the $5. Increasingly, NGOs are not. 2015 was the year of Cyclone Pam and the Nepal earthquake. It was therefore an exceptionally good year for fundraising, but, unlike the Tsunami, not a year in which fundraising efficiency increased. Since then, development NGOs have spent less on fundraising, and received less.
Funds raised from the general public are the most flexible of all funds available to NGOs, and are often used to cover back-office costs that can’t be charged to projects. Clearly there is a squeeze on, with net funds raised back at 2005-06 levels (and those funds shared by more NGOs). And of course this is all before COVID-19.
From now on we are reporting net as well as gross public donations on the Aid Tracker. It’s an important indicator of the financial health of development NGOs, and a better measure of the challenges they face.
Note: For 2014 onwards, we estimate fundraising efficiency from data for all development NGOs (that is, ACFID NGOs plus two large non-ACFID ones, Compassion plus MSF) for which we have a complete series – which is very nearly all by volume. Up to 2013, we estimate fundraising efficiency using data for the top 15 NGOs, adjusted downwards by 6%, which is by the ratio of fundraising efficiency for top-15 to all NGO for the post-2014 period. Gross donations for all development NGOs is from the Aid Tracker.


