
The significant increases in Australian government aid over the past decade have been well publicised. Australian official aid or Official Development Assistance (ODA) has increased from $1.8 billion in 1999/2000 to a budgeted $5.6 billion this year. Less well known is the very large increase in the size of donations to Australian development NGOs over the same period. At a total of $896m in 2010/11 (compared to ODA of $4.3 billion in the same year), this is a smaller but still significant source of funds for international development.
This post analyses the recent growth of Australian public donations to development NGOs. It also compares the level of and growth in donations across these NGOs. The definition of “public donations” includes bequests and both monetary and in-kind donations. The Australian government also provides significant funds to Australian NGOs in the form of grants, but these, as well as grants from other sources including overseas, are excluded from this analysis.
Ideally, we would like to measure the funds raised by all NGOs who obtain tax deductibility under the Overseas Aid Tax Deduction Scheme, since such NGOs have been assessed to be supporting “activities focused on development and/or relief.” In practice, we are largely reliant on data collected and published by the Australian Council for International Development (ACFID), the umbrella body for Australian development NGOs. Nearly all of Australia’s major development NGOs are members of ACFID. The number of ACFID reporting members fluctuates, but in 2009/10, for example, there were 107 member organisations that reported receiving donations. There are two large development NGOs with tax deductibility that are not ACFID members: Compassion and MSF, respectively Australia’s second and fourth largest development fund-raisers. Information on public donations to these two organisations is also included in the analysis below.[1]
Analysis of aggregate donations
The total donations to NGOs over time are shown below, both in current dollars and in 2010/11 dollars, to adjust for inflation.
 The amount of donations has more than doubled in real terms over the time period shown, with a significant spike in 2004/05 in response to the Boxing Day Tsunami in 2004. Following this, donations did not fall back to their previous level, but growth has been slow and donations have gradually returned to their previous trend.
Annual donations to development NGOs per person have more than doubled in real terms since 1999/2000 and are now at about $40 per person.[2] This is a small amount relative to other expenses: less than half of the amount we spend on pet vet services,[3] but a big improvement on where we were a decade ago.
The following graph compares the rate of growth in donations, official aid (ODA) and national income (Gross National Income or GNI) all in per capita terms. The rate of growth in growth in donations to development NGOs has been more than double the rate of growth in ODA, and more than four times the growth in GNI. However, there has been no growth in per capita donations since 2005/06, even though incomes per capita have continued to grow.

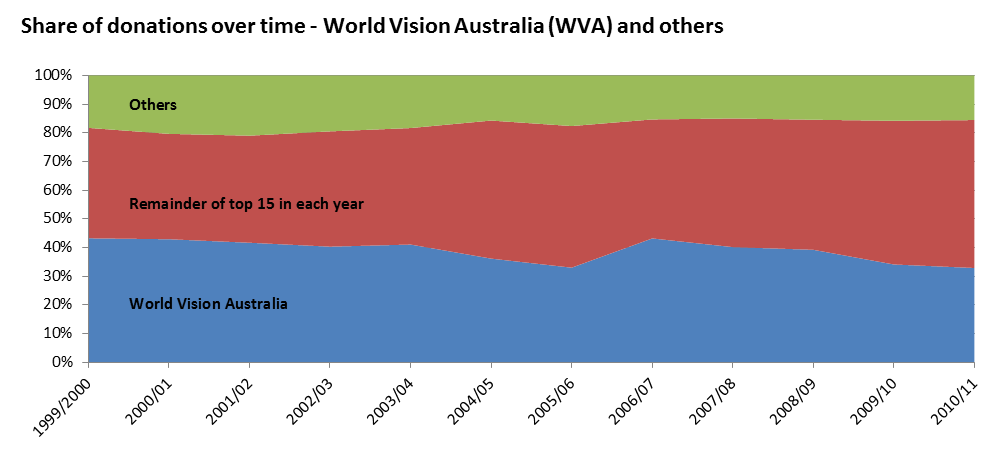
The distribution of funds among development NGOs
The distribution of funds among development NGOs is highly skewed. This section focuses on the top 15 development NGOs ranked by their community donations in 2010/11. Between them, they receive about 80% of all donations to development NGOs.
The most striking feature, shown in the next graph, is the domination of the sector by World Vision Australia. Over the decade under consideration, this one NGO has consistently received in the vicinity of 30-40% of all donated funds, over four times larger than the NGO with the next largest share in 2010/11. Nevertheless, it is notable that World Vision Australia’s share has started to decline, and at the end of 2010/11 was at its lowest level for the period shown below (33%), down from over 40% in 1999-2000.
 The next graph shows how the individual shares of the other 14 NGOs have changed over the decade.

There has been considerable churn within the sector. Some of this is random. Red Cross funding goes up and down since it raises funds to respond to disasters and crises. But some structural trends can also be detected.
The rise of a new group of NGOs is illustrated in the graph below which creates a “high growth” group of NGOs and a “low growth” group, using the median annualised growth rate of 13% as the divide. There are seven in each group. (World Vision is excluded from this analysis. Its annualised growth rate was 6% p.a.)
The low growth rate group received 25% of all donations in 1999/2000, falling to 23% 11 years later. However, the high growth rate group received only 8% of all donations in 1999/2000, but 28% 11 years later. That is, the high growth group started the decade much smaller than the low growth group, but ended it bigger. Of the five biggest NGOs at the turn of the century (World Vision, Oxfam, ChildFund, Caritas, Compassion), only Oxfam and Compassion have grown their share of donations.
Why have a group of “insurgent” NGOs done so much better than the established NGOs? Part of it must be that it is easier to show fast growth from a low base. But part of it might be that some of these fast-growing NGOs are ones with fairly simple “we save lives” messages: MSF and Fred Hollows Foundation, for example.

The sector is evenly split between child sponsorship agencies and others. ChildFund, Compassion, Plan and World Vision are the main agencies which practice child sponsorship. They make up 46% of the sector, but only Compassion is in the high growth group.
Finally, the sector is still dominated by agencies with a religious affiliation but is becoming increasingly secular. The share of donations received by religious NGOs, out of the top 15, has fallen from 71% in 1999/2000 to 57% in 2010/11. This reflects the fall in the share of World Vision Australia of top-15 donations from 53% to 39%.
Conclusion
The overall picture presented by this data is of a development NGO sector that has experienced strong growth in the last decade, but whose expansion has slowed in recent years. While overseas donations are still a tiny part of the ordinary Australian’s expenditure, Australians do on average give more than twice as much they did 11 years ago, even adjusting for inflation.
The internal structure of Australia’s development NGO sector is changing. World Vision Australia previously dominated the field with a share of donations of more than 40%, but its share of the market has declined in recent years to 33% in 2010/11. Some other established players are also losing ground to a number of earlier much smaller NGOs who have been growing quickly, and who are shaking up the structure of the NGO development sector.
Sophie Roden has just completed an undergraduate degree at the ANU in law and economics and undertook this research as part of her internship with the Development Policy Centre. Michael Wulfsohn is undertaking graduate studies in economics at the Crawford School and is a part-time Research Officer at the Centre. Stephen Howes is Director of the Centre.
List of acronyms and abbreviations:
ACFID – Australian Council for International Development
ANU – Australian National University
AUNHCR – Australia for UNHCR
Caritas – Caritas Australia
Compassion – Compassion Australia
CHILDFUND – ChildFund Australia
Fred Hollows – Fred Hollows Foundation Australia
GDG – Global Development Group
GNI – Gross National Income
MSF – Médecins Sans Frontières Australia
NGO – non-governmental organisation
ODA – Official Development Assistance
OXFAM – Oxfam Australia
Plan – Plan International Australia
Red Cross – Australian Red Cross
Save the Children – Save the Children Australia
UNICEF – United Nations Children’s Fund Australia
WVA – World Vision Australia
WWF – World Wildlife Fund Australia
[1] In recent years, ACFID has started publishing aggregate data on donations to non-member development NGOs. This data is not available for enough years to be used here. In 2010/11, the total of such donations was $125 million. $118 million of this was donations to MSF and Compassion. In other words, we are not missing much.
[2] Calculated using a population of 22.6 million for 30 June 2011, from this ABS site.
[3] According to this August 2010 article, spending on pet vet services in Australia is $2.22 billion.


Really interesting article you’ve written Sophie. I’m writing my honours thesis on public opinion and the size of the foreign aid budget so it was really nice to finally see the collection of primary data esp. in terms of total dollar amounts. I was wondering if you would be interested in sharing this data – that is if it’s easily accessible. If not, thanks for writing a really useful article!
Joanna the figures are available each year in ACFID’s Annual Reports
Thanks Patrick for the heads up. I emailed ACFID earlier this morning to request access to their annual reports prior to the 2009-2010 FY (given that subsequent ones are accessible on their website).
There are a few in the National Library as well (early 2000s). If you want older ones pre-2000 then there are ACFOA Archives (MSN 9347) in the National Library as well.
Hi Joanna,
We have every intention of releasing the data. We are currently in the process of putting all of the sources together into one sheet and cleaning it up to make it presentable. We will release it either as a comment on this blog post or in a subsequent blog post in the coming weeks.
Regards,
Jonathan
What is particularly interesting is that if you look at NGO aid spending from their public donations (excluding govt funding) it has been around 0.03%-0.04% of GDP since the 1970 (see Lissner 1977 “Politics of Altruism” for the early figures), a remarkably stable figure, and an interesting observation on public altruism for overseas aid.
Really useful article Sophie. Thanks for posting. What struck me was the relatively small size of the Red Cross. Less than four percent!