

The results of the Development Policy Centre’s 2024 public opinion survey about aid are in. Our surveys are designed to track attitudes to aid spending over time. To do this as reliably as possible we use the same (reputable) survey firm whenever we can, and we ask the same question each year, providing information on the share of federal government spending that is devoted to aid.
The results of the 2024 survey are shown below along with the results of our 2023 survey.
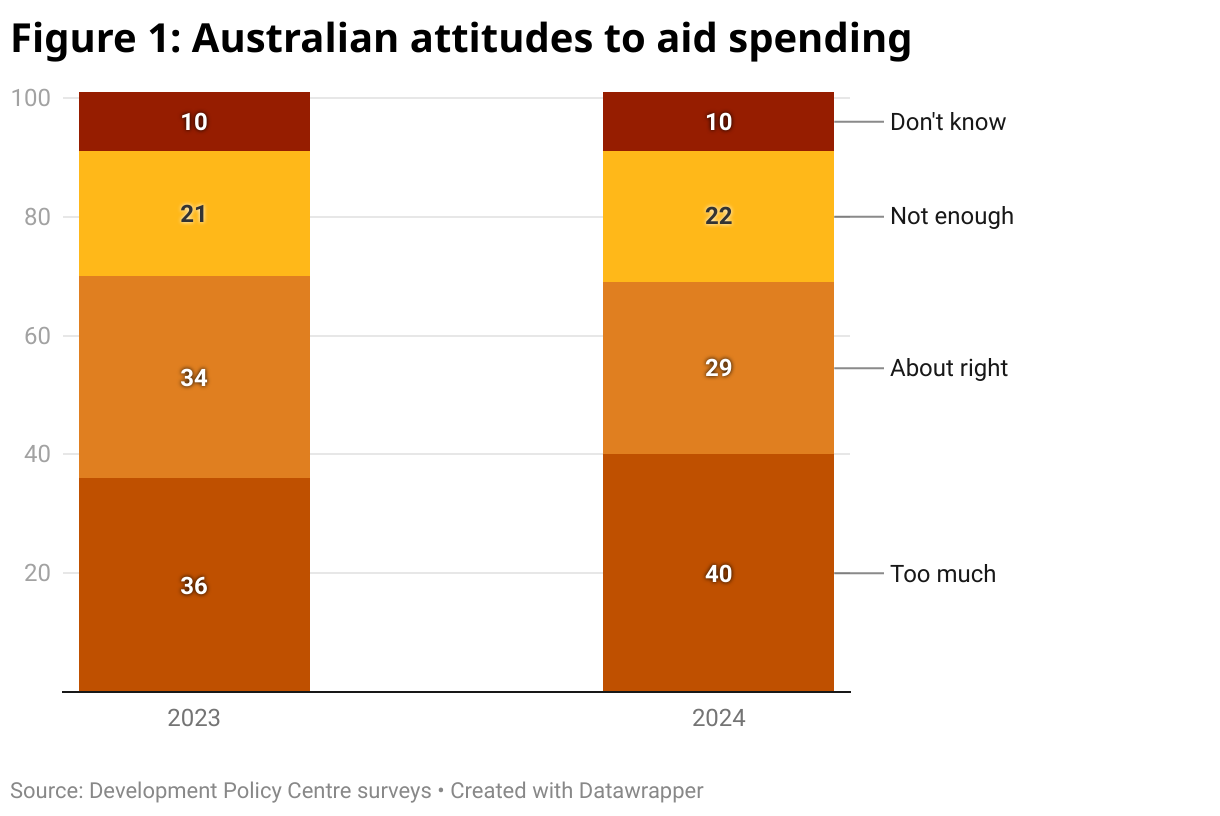
As you can see, the share of Australians who think that Australia gives too much aid is on the rise, yet this isn’t because fewer Australians think Australia gives too little aid; the share who thinks Australia gives too little is effectively the same as last year. The real change between the two years has been the fall in the percentage of Australians who think Australia gives the right amount of aid.
Although hostility to aid is on the rise, it’s worth noting that only 40% of Australians think Australia gives too much aid, while 51% think Australia gives about the right amount of aid, or too little. In a sense, that is a surprisingly good finding given inflation and rising interest rates, as well as the current government’s reluctance to increase domestic spending.
The next chart shows the full time series of Devpol polls since 2015. Care is needed when comparing 2022 to subsequent years as we had to change survey firms after 2022. What’s more, 2022 seems like an unusually positive year, possibly due to the bounce-back from COVID, as well as increased awareness of the need for aid because of the pandemic.
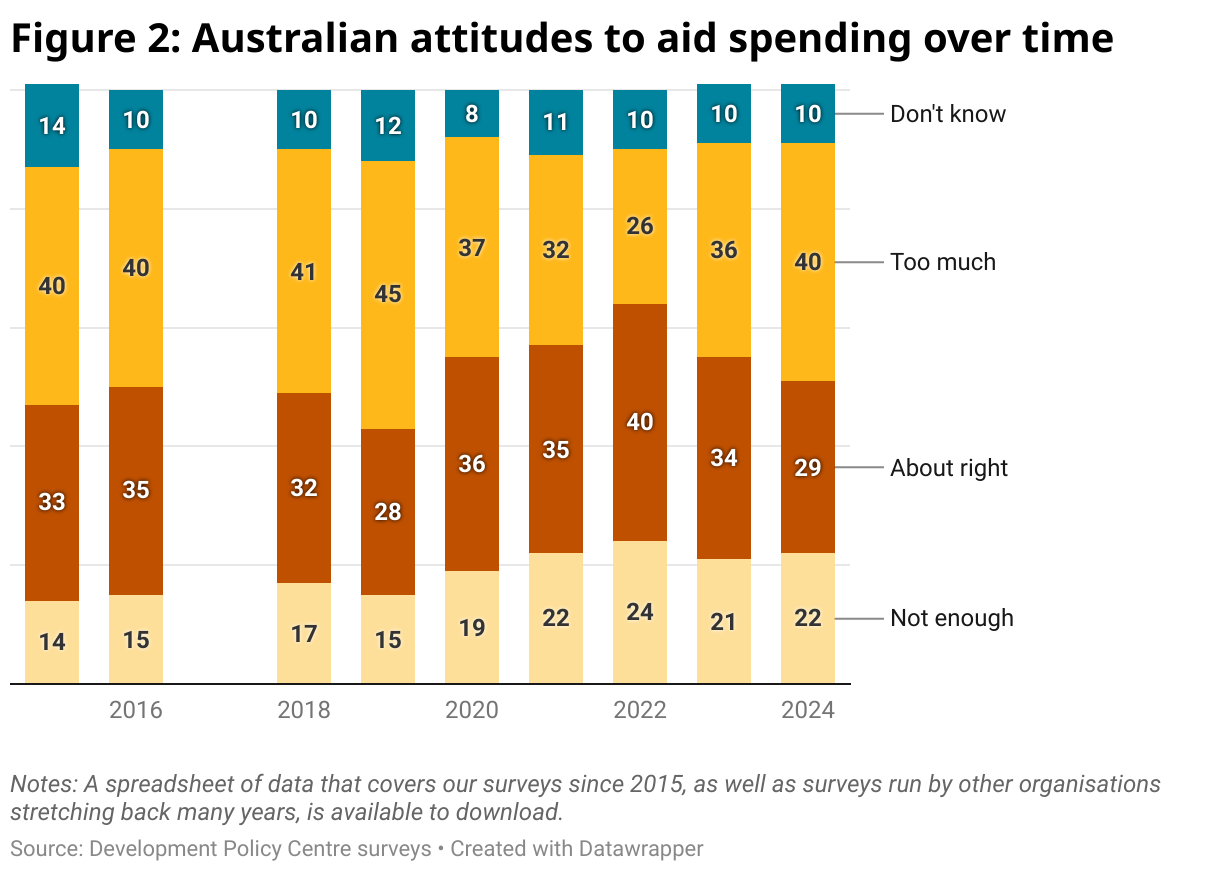
With appropriate care taken, the time series does reveal some interesting points. The belief that Australia gives too little aid is much less prone to change than the belief it gives too much. However, annual fluctuations notwithstanding, there has been a clear increase in the share of Australians who think Australia gives too little aid over time. The rise probably came to an end in 2021 or 2022, but there hasn’t been a clear decrease since. This should be of some encouragement to campaigners for more aid.
One other way our survey data can be useful is that they can be used to get a better picture of which types of Australians are more likely to have different attitudes to aid.
The first chart below is from 2024 and is focused on the belief that Australia gives too much aid. It shows the simple bivariate relationships between particular traits and the belief that Australia gives too much aid. The x-axis shows the change in probability. The top line, for example, shows the average difference between Greens voters and Coalition voters. The next three lines do the same for other groups of voters relative to Coalition voters. The four sociodemographic lines show the average differences between people in the groups indicated and the complements of those groups — for example, the bottom line shows the difference between people that earn more than the median income (in the sample) and people in households that do not.
Figure 3: Comparing individual traits and belief that Australia gives too much aid
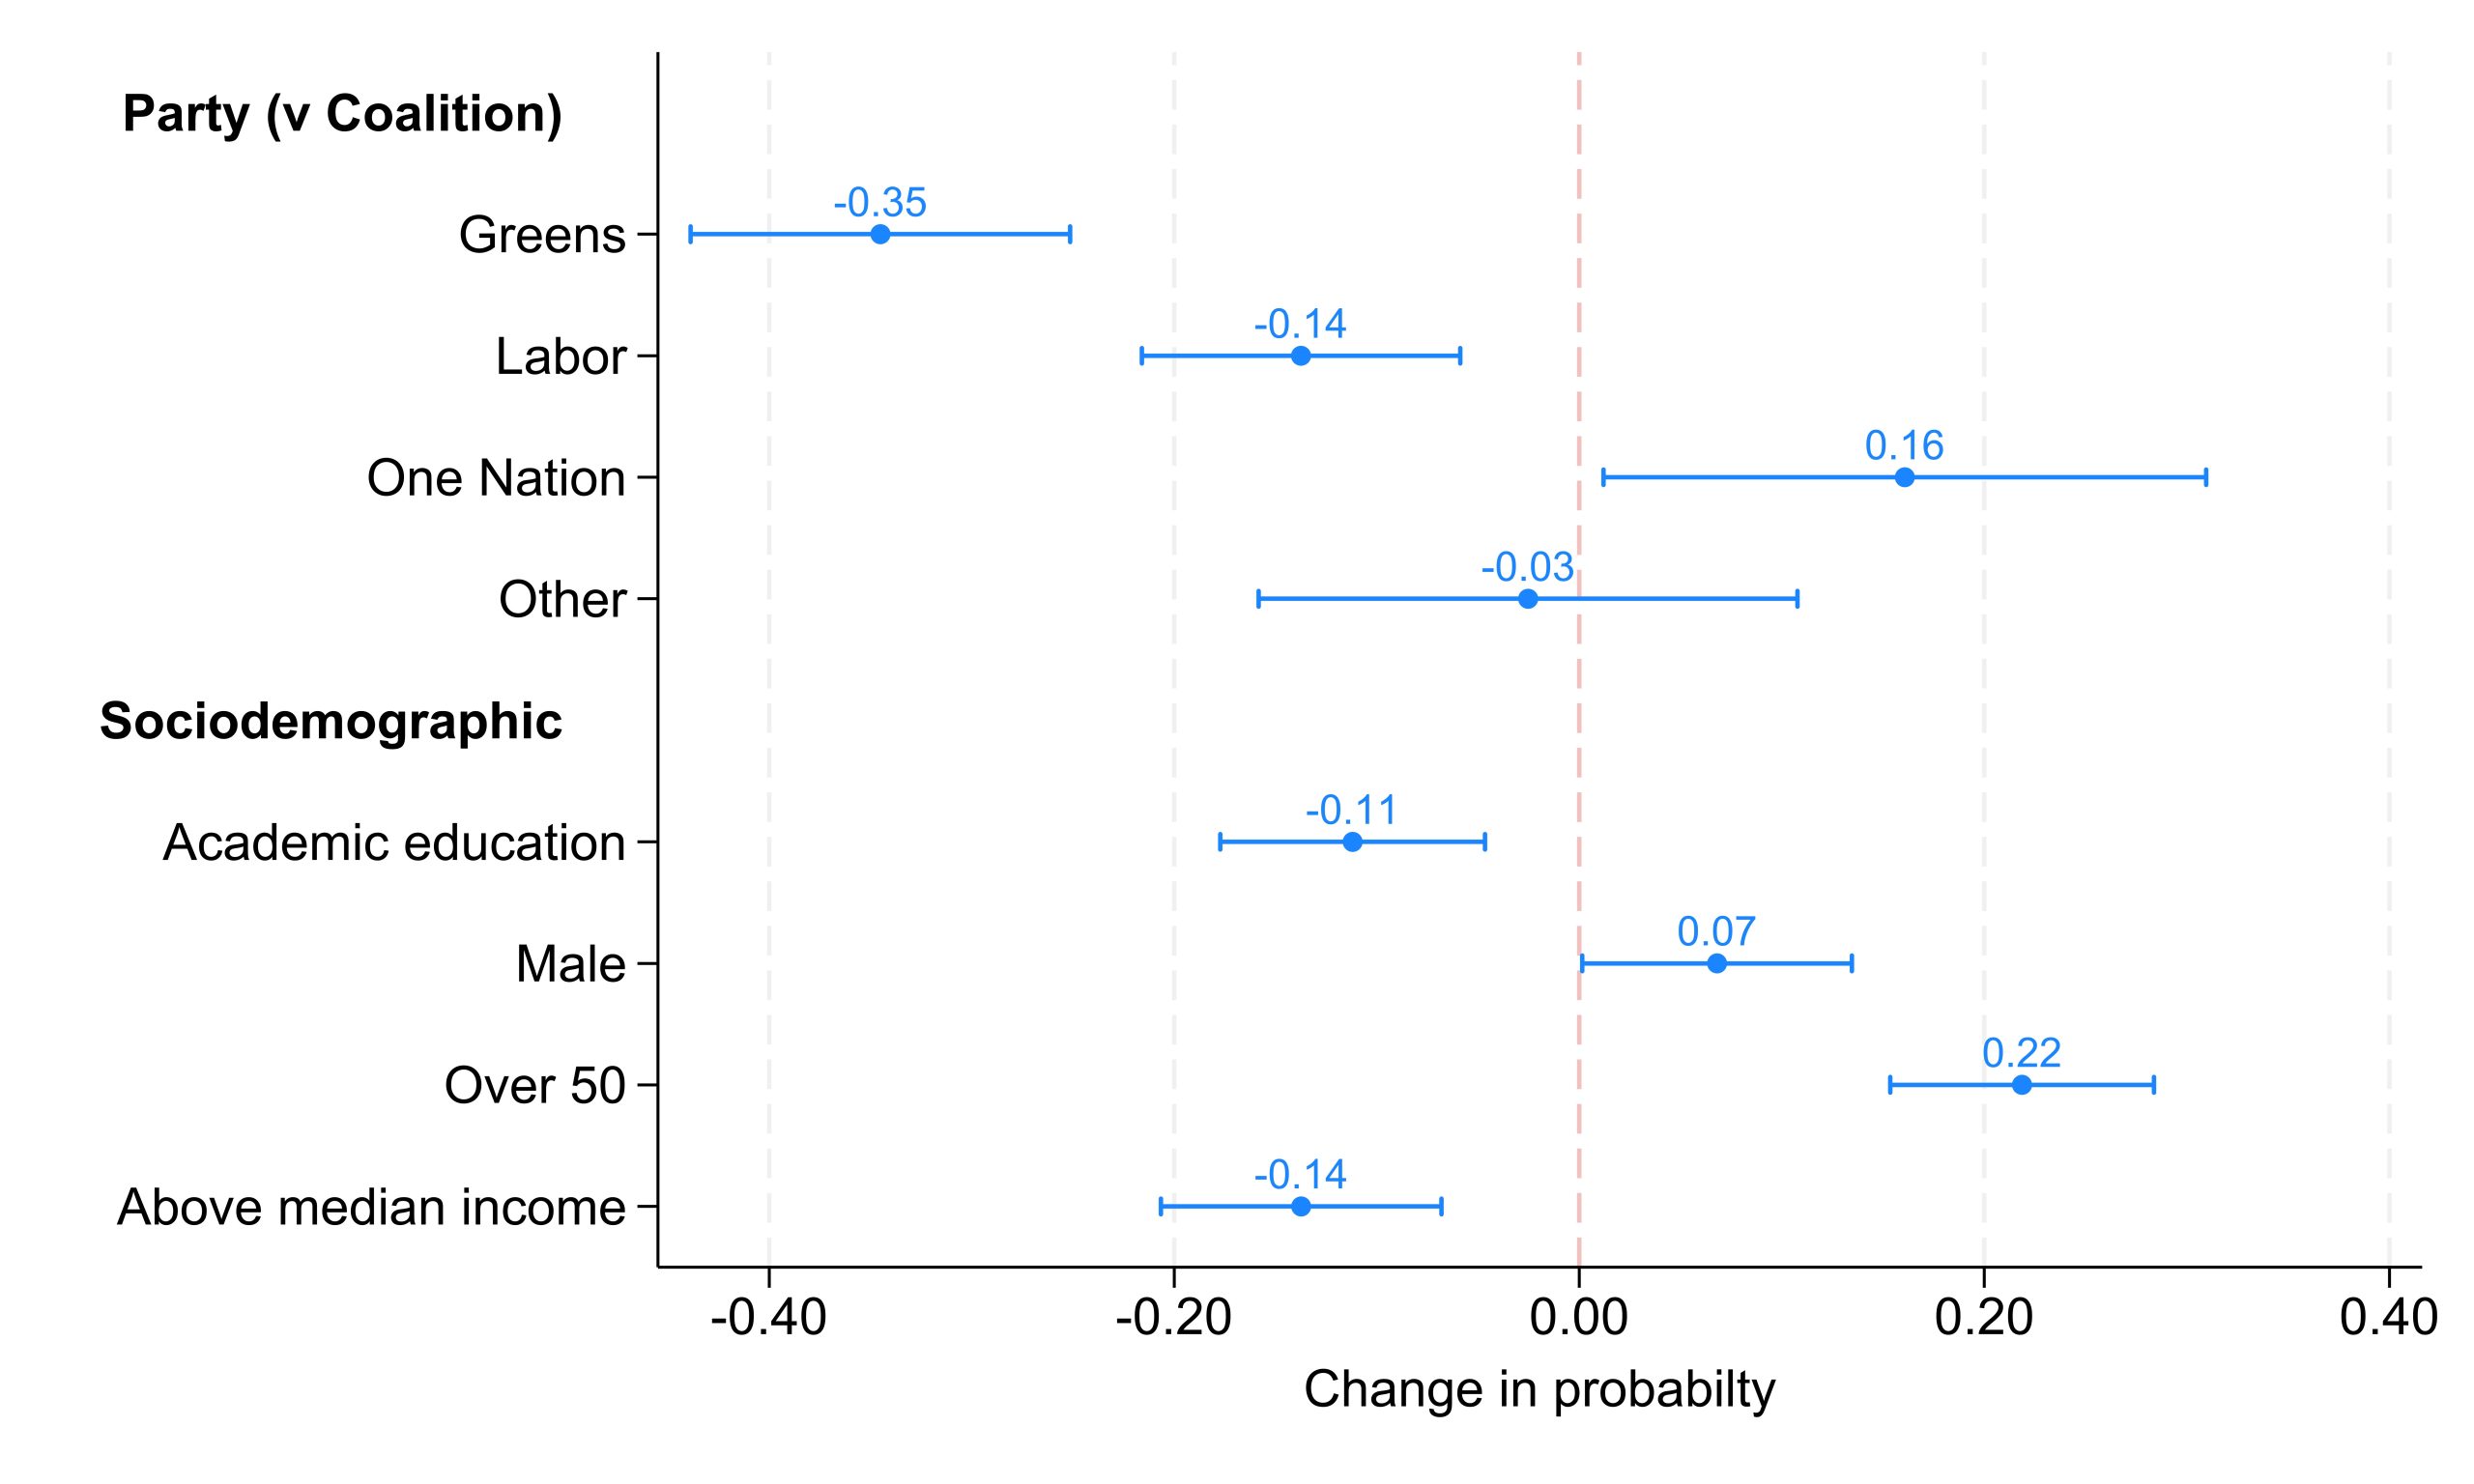
There are clear differences. Voters on the left are much less likely than Coalition supporters to think that Australia gives too much aid. Unsurprisingly, One Nation supporters are more likely. People with an academic education as well as more affluent people are less likely to think Australia gives too much aid, while men and older people are more likely.
The chart below shows the results of another logistic regression. This one contains multiple independent variables together. I’ve done this to account for relationships between the various traits. Wealthy people, for example, might be more likely to vote for the Coalition, but including both income and party preference in the same regression accounts for this, affording a sense of the effect of ideology independent of the effect of income, and the effect of income independent of ideology.
Figure 4: Comparing multiple traits and the belief that Australia gives too much
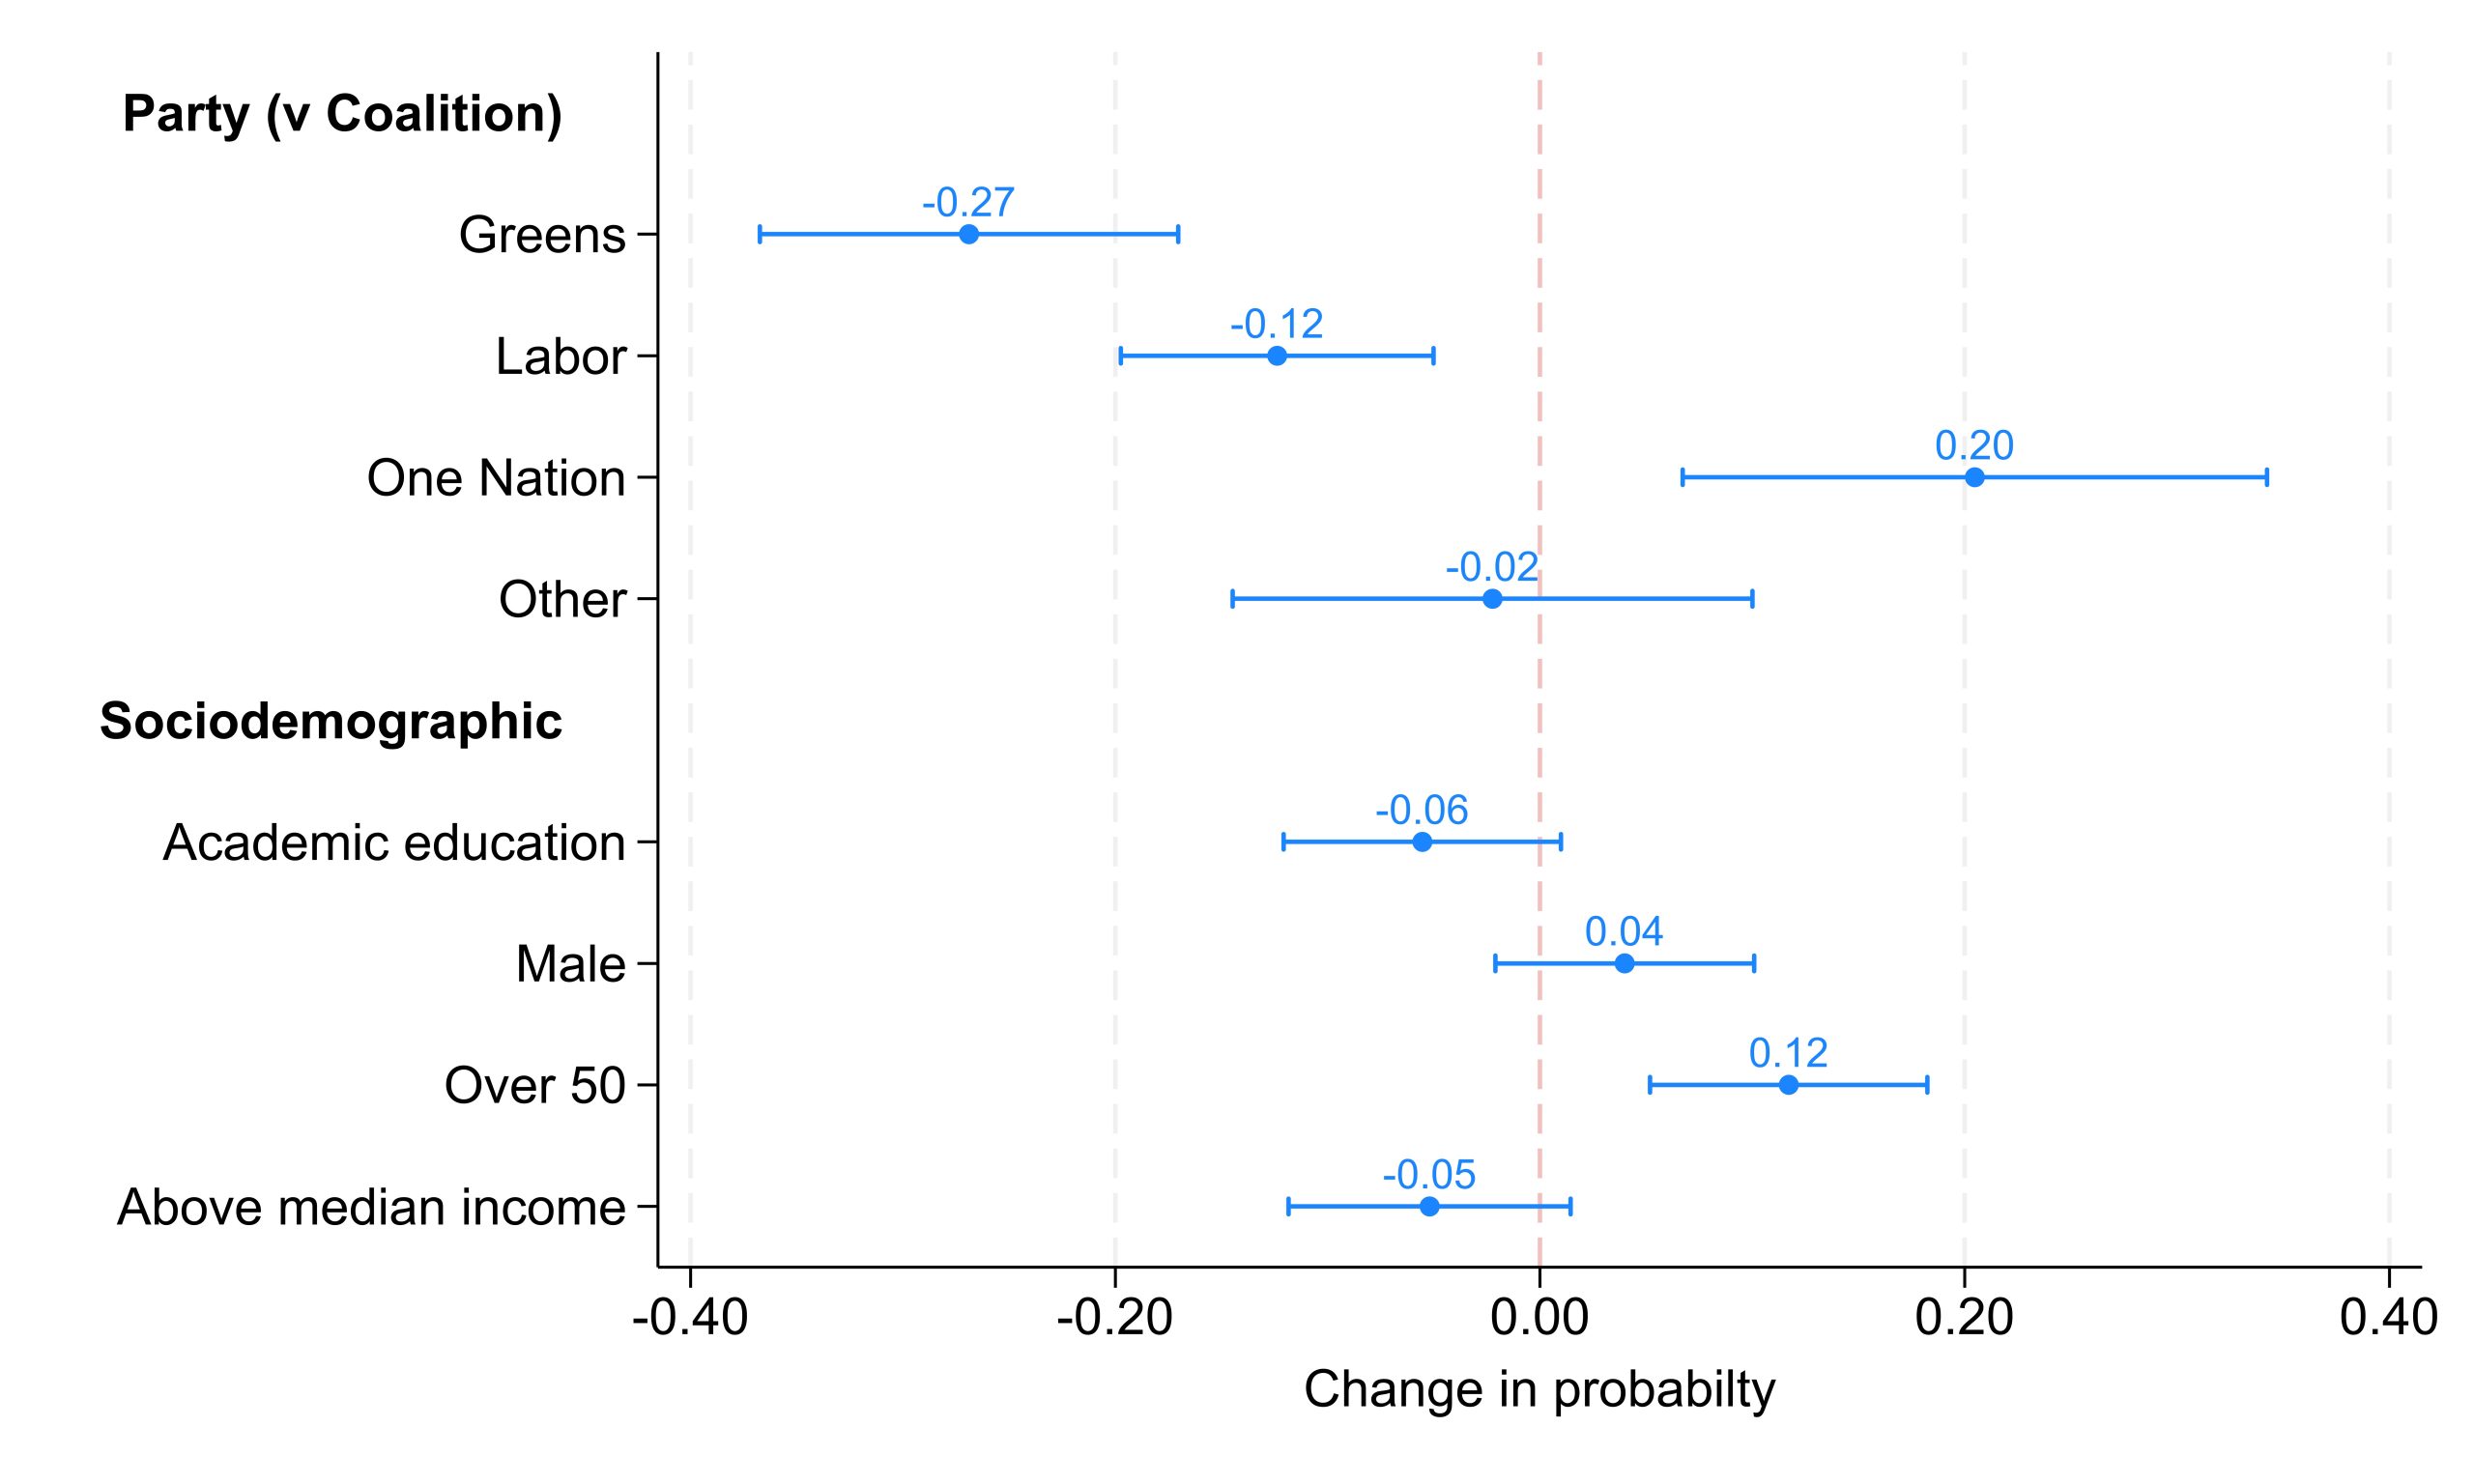
Once again, the chart reveals a stark ideological divide. Even when we take into account other traits, people on the left are much less likely to think Australia gives too much aid than people on the right.
Other differences are less clear in this chart though. With the influence of other variables controlled for, the relationships between income and gender and the belief that Australia gives too much aid are no longer clear (not statistically significant). People with an academic education are probably less likely to think Australia gives too much aid, although this relationship is only statistically significant at p<0.1 (in other words, it’s not completely clear). One clear finding remains though, which is to do with age: even when controlling for other traits, older people are more likely to think Australia gives too much aid than younger people.
While they aren’t a majority, in 2024 a large share of Australians believe their government gives too much aid. If you are trying to figure out where the heart of this hostility lies, it appears to be foremost amongst the old and on the right.
Note: A spreadsheet of data that covers our surveys since 2015, as well as surveys run by other organisations stretching back many years, is available to download.


Thanks, Terence.
I would much prefer that all Ministers for Foreign Affairs actually highlight what is achieved through those various expenditures of our aid. Saying how much is up or down in the dollars of the aid budget is really only the beginning.
We give aid for specific objectives in the recipient countries or programs. In my 48 years of involvement in government decisions around aid and its priorities, I have never seen or heard a Foreign Minister announce something like: “In the past X years, we have given $Y with the objective(s) of (e.g) reducing mortality in those children aged under five. Our priorities were in (named countries).
We are proud to conclude over those “X” years that “Z” million children have been vaccinated against the six vaccine-preventable diseases, like measles and diphtheria. That means (Z) million children will be alive after five. That means they have an excellent chance of a healthy adult life.
The healthy lives we take for granted for our Australian children are now possible for those millions of children in (named countries). That’s what our overseas aid money achieves.”
So much of the aid debate has been sterile: “percentages of national budget”, “annual Budgets up or down”, “corruption in recipient countries”.
When real outcomes are identified by Government, that debate changes focus – where it belongs. On benefitting the lives of those in poverty around our world.
Terence
From your numbers you could add 22 and 29 and say a 51% majority ( barely) don’t want aid cut. To me that’s a long bow when up or down its really just 22% saying it should be more versus almost double that, 40% saying it should be less.
But surely as its taxpayers money – the far greater majority is the 40 and 29 – 69% clear majority that say current AID is enough or more than enough.
Given how tough people in Australia are doing it – Id say that 69% is pretty relevant come election time – if Albanese, Marles and Wong keep throwing our taxes around like its their own.
I wonder how many of the 22% who say “not enough” actually pay much income tax. Could make that a demographic question next survey.
Hi Jason,
You state: “if Albanese, Marles and Wong keep throwing our taxes around like its their own”. And you emphasise that most Australians are not in favour of an aid increase. I’m not sure where your information on government spending comes from, but it is worth noting that the current government is not increasing aid in any meaningful way. The aid budget is staying static when inflation is taken into account. Aid is falling as a share of government spending. And aid is falling as a share of GNI.
Terence
Terence
I don’t call it Government spending I call it the spending of our taxes.
My research is not into spending percentage. My research is done by how much new AID they announce near every time they get off an international flight.
They have to make sure the budget gets spent I guess.
If AID is falling as a share of so called ” Government spending” and as a share of GNI – excellent. Only 22% wont be happy. A clear minority.
Could ask that 22% next survey – how many of them pay income taxes.
Thanks for continuing this survey. As you point out in your commentary, it is interesting (and encouraging) that attitudes towards development spending haven’t soured even more sharply given the financial pressure many Australian households are currently experiencing. It would be interesting to know if attitudes towards aid would shift depending on the type of assistance (ie health, education, economic, law and order, environment etc). You’ve undoubtedly considered this but just a suggestion.
Thanks Adrian, this would be a great idea for a survey experiment: emphasise different sectors that aid is focused on and see whether some were more likely to change attitudes. Some of our work has touched on this, but we haven’t tested it directly.
See here for more: https://papers.ssrn.com/sol3/papers.cfm?abstract_id=4249482
Agreed Adrian.
Ive lived in the Pacific for 35 years. I don’t see our AID spend making much difference.
Splitting into areas spent – would at least allow us to pose questions on why things still don’t improve. The standard 3 year consultant who writes a 500 page report and leaves needs examination for starters.
The annual research continues to be interesting. However, other studies indicate that many people over-estimate the amount of Australia’s foreign aid. Have you tried to control for that, ie to understand if people who say Australia gives too much aid actually understand how low it is compared to other countries?
Hi Clay,
Thank you for the comment. We provide people with information on the size of the aid budget. We tell them aid/federal government spending. (Absolute aid amounts seem large, even though they are not. Most people don’t understand GNI. So we use government spending as the denominator – it’s pretty easily understood.)
Here’s our question wording.
=
Every year the Australian government gives aid money to poorer countries. Currently just under $1 out of every $100 of federal government spending is given as aid. Which one of the following options best reflects your opinion about aid spending?
=
Interestingly providing Australian’s with accurate information on aid spending in experiments didn’t seem to shift views much.
See:
https://papers.ssrn.com/sol3/papers.cfm?abstract_id=4249482
and
https://papers.ssrn.com/sol3/papers.cfm?abstract_id=2885536
Thanks
Terence