
Papua New Guinea has many parties in parliament. PNG’s average of 19.6 parties elected at each election between 1997 and 2017 is higher than many other countries with multi-party systems. (For example New Zealand has had on average five parties in its parliament in the same period.)
When discussing parties in PNG’s parliament, it is important to realise that some MPs are elected unaffiliated to any party (so-called independents). The share of MPs elected as political party members was at its lowest in the 1990s, but has been 80 percent and above since 2002.
Parliament share of MPs with party affiliations 1977 – 2017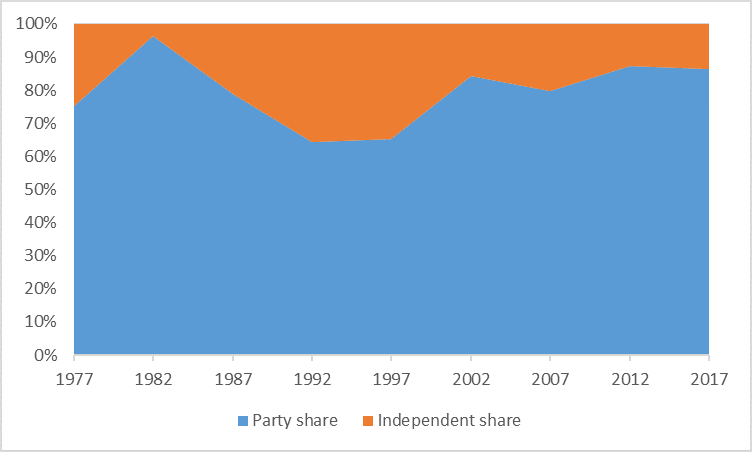
As the chart below shows, the number of parties in parliament was 7 in 1977, increasing to 10 in 1987. It stayed at about this level up to 1997, then grew rapidly to 24 in 2002, and has since fallen to 21 in the last two elections.
Twenty-one parties is a very high number, but the picture changes somewhat when party size is considered. Also shown below is the effective number of parties (ENP), a measure of the fragmentation of parliament. The ENP measure was first introduced by Markku Laakso and Rein Taagepera in 1979, and weighs the number of parties according to total number of seats won, thus giving a higher weight to larger parties. As can be seen, the effective number of parties increased from 1982 to 2002, but has fallen since. PNG’s ENP is, however, much lower than the total number of parties. This suggests that, although many parties are elected to parliament in PNG, only a smaller group have had substantial numbers of their MPs elected at each election.
Even though a smaller group of parties has substantial numbers, PNG’s ENP of 6.9 in 2017 is still high by global standards. According to a 2019 study of over 140 countries (not including PNG), only five other countries had a higher ENP between 2017 and 2019: Belgium (9.7), Bosnia and Herzegovina (8.7), Brazil (16.5), Indonesia (7.5), and the Netherlands (8.1).
We can also look at the number of parties that have had more than three MPs elected since 1977. This number follows the ENP closely, except in 2002 and 2007. 19 different parties have had more than three MPs elected in at least one election since 1977. However, only two, PANGU and People’s Progress Party (PPP), have existed since independence and had more than three MPs elected in each election. The PANGU party has been the most successful, averaging 17.7 wins in every election since 1977 (though it only won one in 2012). The PPP has averaged 9.2 wins over the same period.
Parties in parliament 1977 – 2017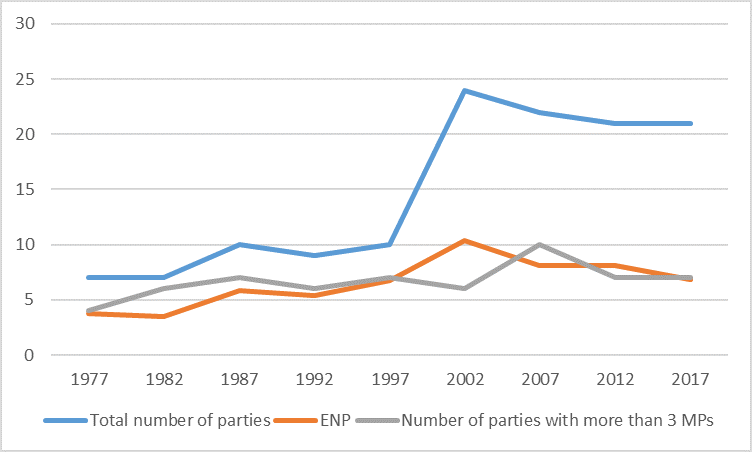
When governments are formed in PNG, they usually have large established parties at their core. The table below shows which parties have held the important positions of prime minister (PM) and deputy prime minister (DPM) and their relative sizes, both immediately after elections. Except for 1987, 1992 and 1997, the ruling party (PM’s party) has always been the largest in parliament. The PM’s and DPM’s parties have never on their own commanded a majority in parliament. Governing coalitions have required more parties.
Parties (share in parliament) in coalition 1977 – 2017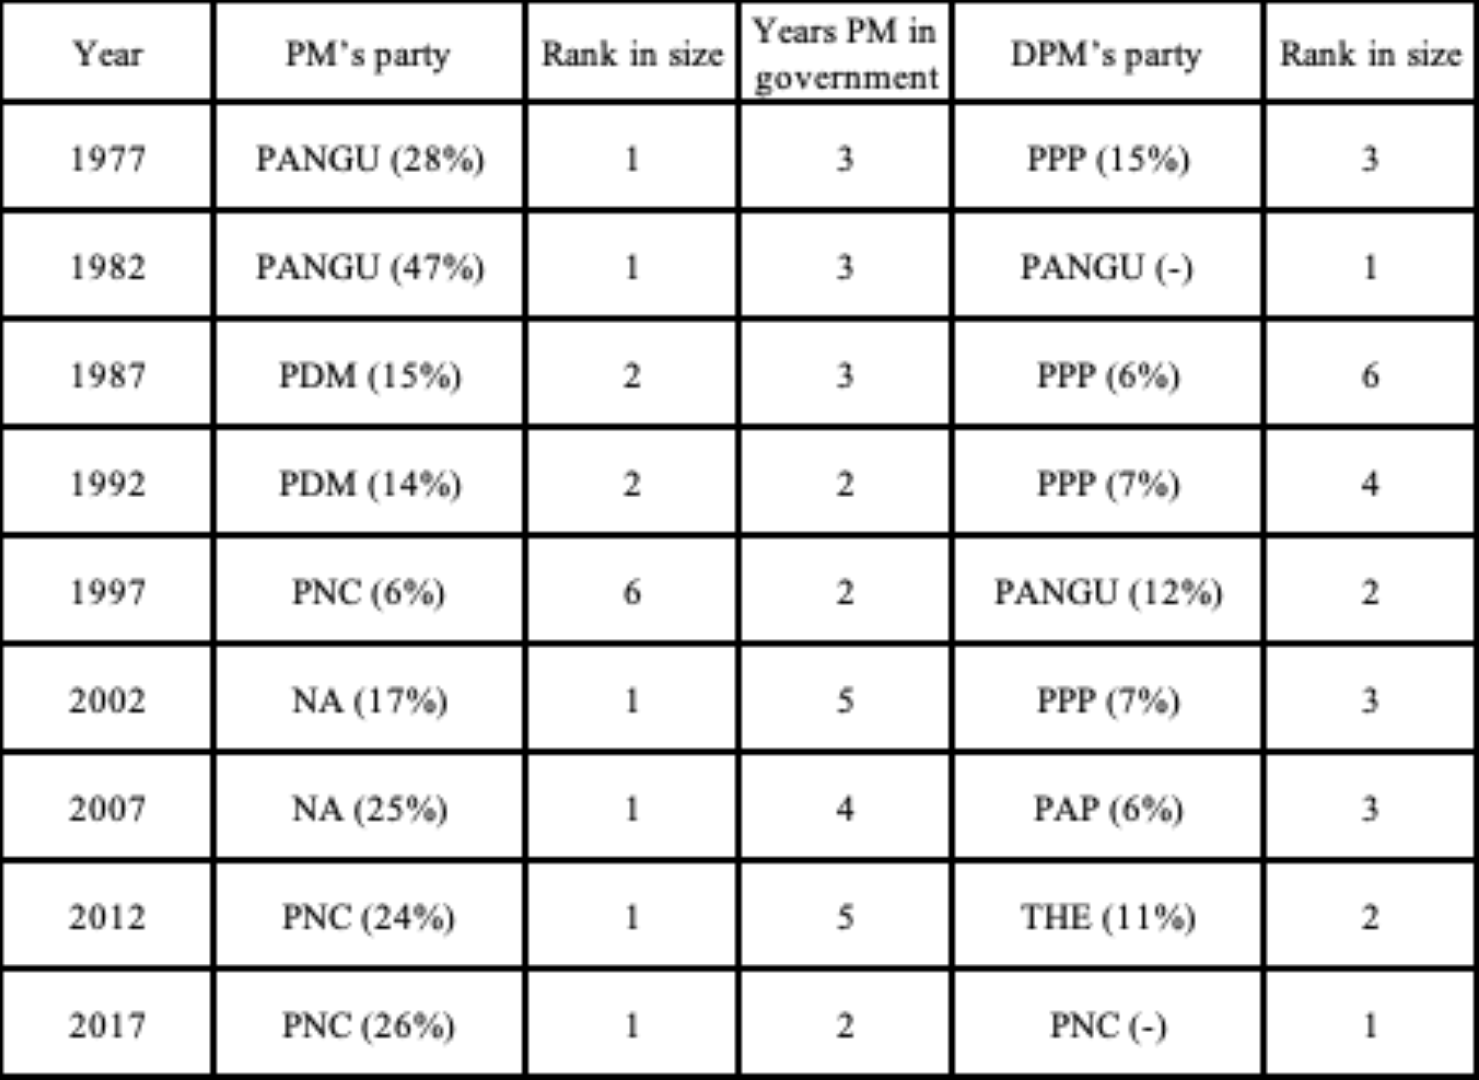
The average number of years that any PM, after the election, has been able to serve is 3.2 years. Is there a relationship between government tenure and how large the PM’s party is, or between the number of effective parties?
It seems reasonable to assume, first, that governing coalitions with larger parties at their heart will serve longer; and, second, that more fractured parliaments will be more unstable.
The charts below show the relationships of interest.
Years in government, effective parties, and ruling party’s share in parliament 1977 – 2017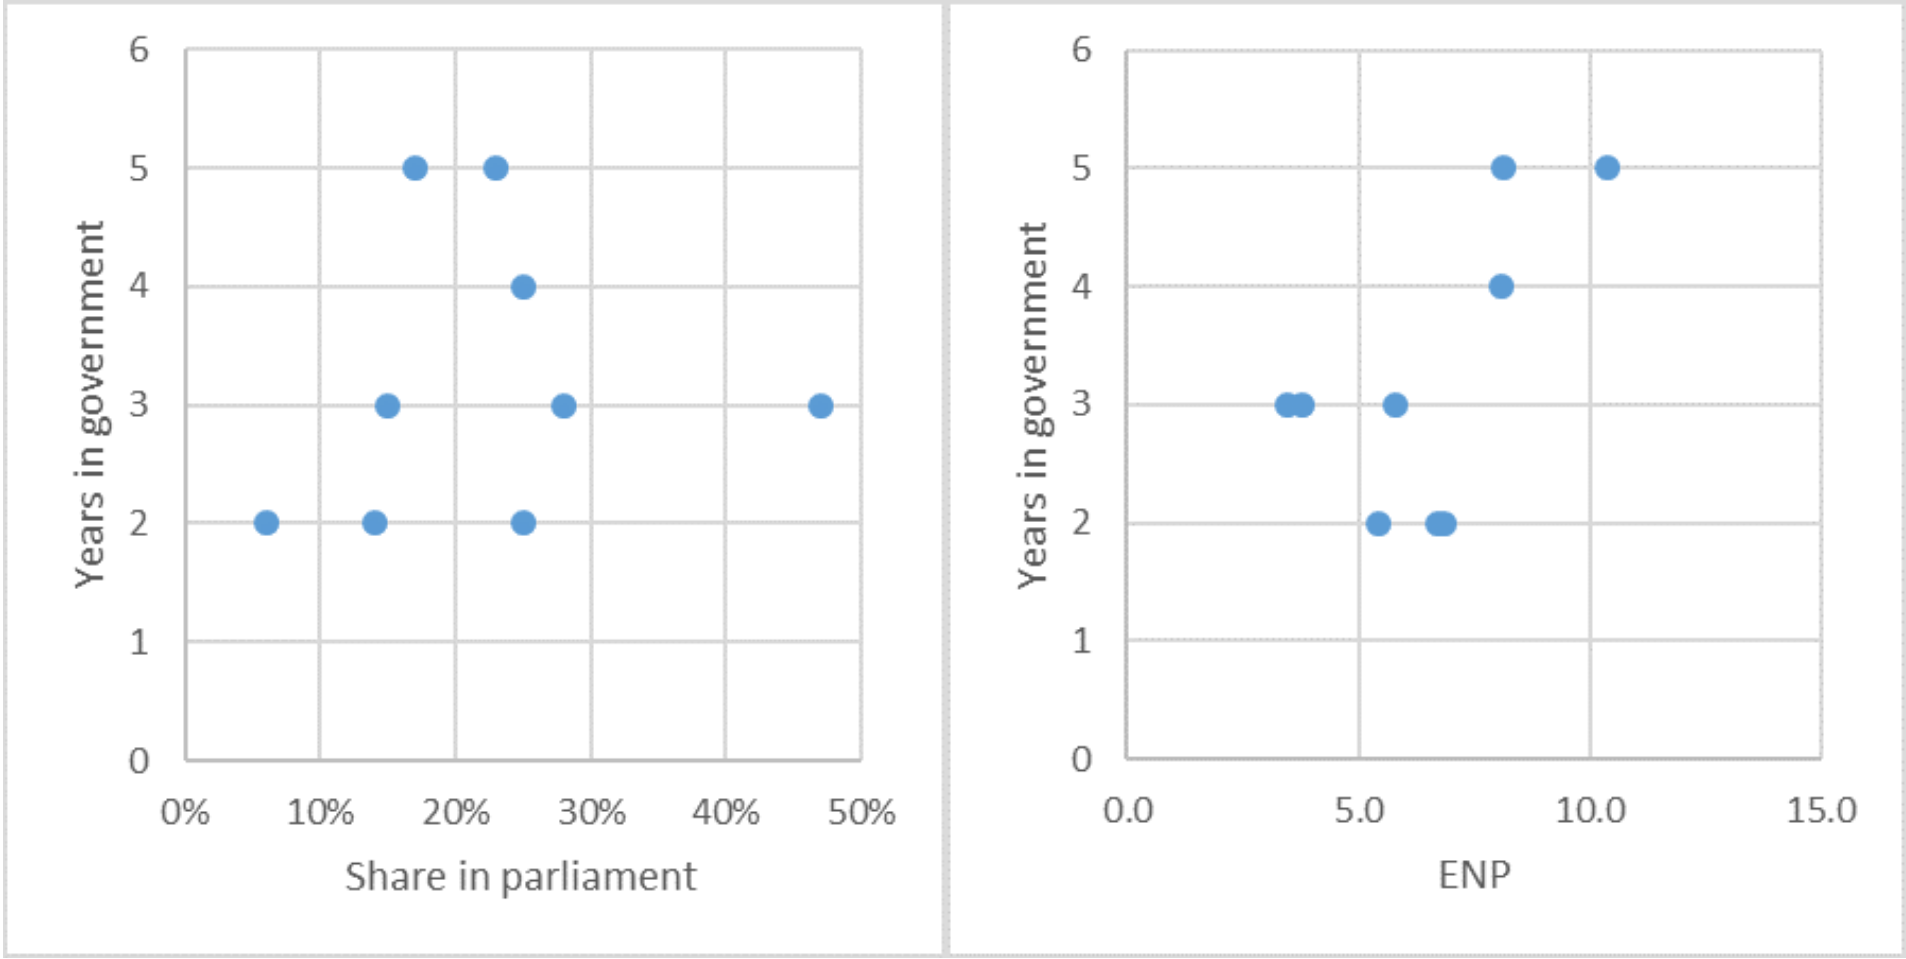
Surprisingly, there is almost no relationship between the share of seats in parliament held by the PM’s party and the length of the government’s tenure (r = 0.14). There is a much clearer relationship between how fragmented parliament is and length of government tenure (r = 0.62). However, the relationship is the opposite to expected: when parliament is more fragmented, governments have been more likely to stay in power. This may simply be a product of chance and two unusually long-lived recent governments. But even if these governments are ignored, there is no sign of the expected negative correlation. More fragmented parliaments do not lead to shorter government tenure.
In summary, although PNG’s parliament is made up of many parties, a smaller number of large parties form the centre of political coalitions. Yet surprisingly, greater fragmentation following the elections does not seem to lead to increased political instability.
Notes: The author would like to thank Dr Terence Wood for insights and comments on earlier drafts. Party data were taken from a number of sources: H. Okole (2005) ‘The fluid party system in Papua New Guinea’; R.J May (2008) ‘Political parties in Papua New Guinea’; M. Rooney (2019) ‘Political developments in Papua New Guinea in a historical context’; PNG Elections Database; and Wikipedia ‘Elections in Papua New Guinea’. Effective parties were calculated using the effective parties index by Laakso and Taagepera (1979) ‘Effective number of parties – measure with application to West Europe’, and using number of party wins at elections, excluding seats for which election results were yet to be declared. This paper assesses party membership at the time of the election, counting only elected MPs who campaigned as a party member. After elections, some independents join parties, and during the parliamentary term, a number of MPs switch sides. These are matters for further research.
Constituency Development Funds goes back to 1984. It took different names, the most recent being DSIP/PSIP. So CDFs were still used during NA’s 9 years.
There was an increase under O’Neill, but the habit of using CDFs to punish or reward MPs preceded O’Neill. Ketan (2007) gives details on the abuse of CDFs, including under NA, to consolidate power.
Looking forward to the next piece.
Thank you for this interesting blog post.
You found that “when parliament is more fragmented, governments have been more likely to stay in power” and you provided a scatter plot graph to show this trend. Are you willing to speculate as to why that might be? I wonder if it could be because of the necessity for leaders to emphasise coalition building, relationships, and inclusion of MPs from diverse parties in decision-making processes.
I have one other minor question. What do the horizontal lines in the table refer to? It’s where you have the DPM’s party column and some entries don’t have percentages listed.
Thanks again,
Amanda
If I were to speculate, I would say that a more fragmented parliament would comprise more parties with more than 3MPs, but fewer with substantial size as to challenge the ruling party.
The dash in the table is to indicate that the DPM is a member of the PM’s party, and the percentage is not given as the table tries to give a sense of total size of the two dominant parties (PM and DPM) in the coalition, if they are able to form government on their own, or would they require other parties.
But as Michael alludes to below, there may be other factors that contribute to political stability.
Hi Maho, this a good piece. However, it shows patterns but doesn’t explain why these patterns emerge.
For instance, by 2002 OLIPPAC (sec 63) requires party with the largest number of MPs following a national election is invited to form the government (if there are two or more parties with the same number of MPs, party with the highest share of votes would be invited). This may explain why PM’s position is always held by the party with the largest party and not smaller parties. If you compare government formation after election where sec 63 applies, and Vote of No Confidence where sec 63 doesn’t apply, it’s almost the reverse. In a VONC, PM in recent years at least, have come from smaller parties.
This may mean that PM comes from the party with the largest number of MPs because it’s required by law. If there was no OLIPPAC, would larger parties still form the government?
Data for 1987, 1992 and 1997 shows otherwise.
Second, government stability in recent years has largely to do with control of discretionary funds by the PM. PM’s party grows after elections (O’Neill’s party grew from 5 men when he became a PM in 2011 to about 80 when 2017 elections came around).
Great job.
Thanks Michael, this was a descriptive piece, and possible reasons for political stability are beyond the scope of this blog. We’re working on a discussion paper on parliament fragmentation, and will address these questions there.
Lack of party/MP tracking data in years between elections limits this analysis.
On the question of PSIP/DSIP levels contributing to political stability, no-one has done a quantitative study to prove this. PNC’s longevity (7 years) as a result of higher PSIP/DSIP, is too small a data set to prove definitively if there is any relationship as Politician-Allocated Expenditure (PAE) were first introduced in 1984 – what about NA’s 9 years? What about governments before 2002? So far, the literature on governments prior to 2012 seem divided on the issue of : Frankel (2011), Chand & Duncan (2007), Batten (2011), and others. I’m also putting together a time series (1984-2020) of real PAE levels to see if there is a relationship between PAE and political stability.