
It is not strange to hear researchers or policymakers complaining about the lack of complete, timely and reliable data in Papua New Guinea (PNG). Speaking for our field of research (macro-econometrics), the adverse effects of PNG’s poor data can be best seen in the inconsistency of the country’s gross domestic product (GDP) data. This article documents how the data reported for PNG’s GDP varies hugely across almost all sources and how this problem could severely jeopardise analysis.
In PNG, the National Statistical Office (NSO) computes the official annual GDP. This itself is a challenging task. The disproportionately high informal economic sector in the country, which more than 80% of the country’s livelihood depends on, makes it extremely challenging to capture the full picture of the economy. It is further exacerbated by the geographical remoteness of the country – most areas outside of the provincial capitals are hugely inaccessible and disconnected by roads. The statistical agency has also been constantly constrained by a lack of technical expertise. Just recently, the World Bank rated PNG’s statistical capacity as one of the lowest in the region.
In this article, however, we are concerned not with the quality of NSO’s data, but with how that data is reported.
The NSO shares its GDP data with various government departments and international organisations for dissemination and research purposes. But the NSO does not provide a long time series of GDP data, nor does it provide quarterly data. Currently, there are four main sources which report PNG’s GDP data on an annual basis: IMF International Financial Statistics (IFS), World Bank Data Bank, United Nations Conference on Trade and Developments Stats (UNCTAD) and PNG Treasury Budget. These sources have different reporting formats: for instance, UNCTAD and the World Bank only report PNG’s GDP in US dollars, whereas the IMF and PNG Treasury report in local currency (kina). All sources except the PNG Treasury have data from 1970 to 2016. The PNG Treasury only reports data from 2007 onwards.
To ensure data comparability, we first collected the nominal GDP in US dollars for PNG, obtained from the World Bank and UNCTAD, and converted them into kina using the historical nominal exchange rate of kina against dollar published on their respective websites. Then, we compared the nominal GDP for PNG across all sources and graphed the series (see Figure 1). This allows us to examine the similarity of the data before taking into consideration the differences in their respective GDP deflators. In addition, we also compared the real GDP and its growth rate across all sources (see Figure 2 and Figure 3 respectively). See all workings behind this analysis here.
There are three patterns in the figures below that are worth pointing out.
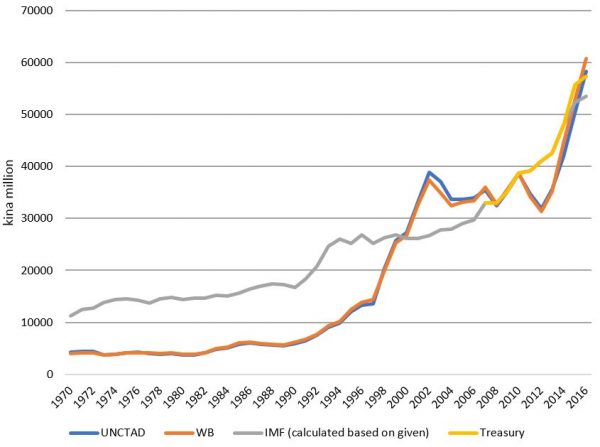
Firstly, none of these sources report a uniform nominal GDP, as shown in Figure 1. The series reported by the World Bank is constantly lower than the data published by other sources. Yet, we argue that the differences should be minimal as they all refer to the same primary data source collected by PNG’s NSO. There is, however, a significant improvement in the consistency of the series from 2007 onwards, where all sources report a similar nominal GDP for PNG, up until 2013 when they diverge again.
Figure 1: PNG Nominal GDP (kina million), 1970 – 2016

Secondly, the real GDP series shown in Figure 2 displays many inconsistencies in the data. The data reported by the IMF is much closer to the Treasury data, whereas UNCTAD and World Bank data differ hugely. The differences are largely explained by the difference in the GDP deflator used by the different sources.
Figure 2: PNG real GDP (kina million), 2010 constant price
Thirdly, these data paint very different pictures of the economy. For instance, the real GDP reported by the IMF in 2003 show a positive annual growth of four per cent, while the data by UNCTAD and the World Bank registered a recession of about six per cent. This phenomenon can also be found in 1995, 2001 and 2012 (see Figure 3). In addition, we also found that the magnitude of UNCTAD and the World Bank’s real GDP series, be it growth or recession rate, is nearly always larger than the one reported by the IMF and Treasury.
Figure 3: PNG real GDP growth rate, 1970 – 2016 (%)
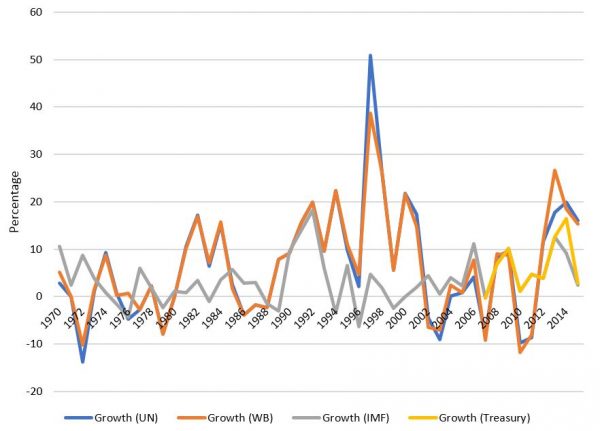
There are some serious anomalies. The real GDP data reported by the World Bank and UNCTAD at times display an excessively high growth rate. For instance, they show that PNG registered a whopping 40%-50% growth in 1998, whereas the IMF only reports growth of five per cent for the same time period. Also, it seems that there is disagreement between the IMF, World Bank and UNCTAD on the country’s real GDP from 1970 to 2000 – Figure 2 shows that the IMF reported a much higher real GDP for PNG in that period.
While we are quite confident that the high growth rates shown in the World Bank and UNCTAD’s real GDP series are erroneous, it is almost impossible for us to tell exactly which source has the most reliable data overall. PNG’s NSO does not constantly revise and update its old data, which leaves all secondary sources out of sync with each other. For instance, we are unsure where and how the IMF, World Bank and UNCTAD obtained the GDP series before 2001, as PNG’s NSO did not revise or update its old GDP series after the methodological changes made in calculating the country’s national accounts in 2001.
The importance of having reliable and consistent GDP data across all sources is almost second to none when it comes to analysing a country’s economic performance. GDP is the most widely-used indicator to measure a country’s aggregate economic activity over a certain period of time, and it is used to calculate range of different indicators such as GDP per capita, debt to GDP ratio, etc. to provide more information about the economy. Some may argue that it is trivial to have small differences in GDP across all sources, but here we are facing not only large, but inexplicable differences.
Documenting the data inconsistency problem in PNG’s GDP should give researchers more caution when analysing GDP, and perhaps also encourage various organisations who publish GDP data to explain the anomalies and revise the data published on their respective websites.
PNG needs one GDP series, not several.


Thanks Paul for your valuable comments. Ideally, it is better to have sector price indices as deflator in obtaining PNG’s real GDP as having one implicit price deflator masks the heterogeneous nature of individual sector. This should paint a clearer picture of the real activity taking place in different sectors and better reflect the economic welfare of the population. Having said that, we know it’s practically not feasible when NSO struggles to even release economic data on a timely manner. Anyway, looking forward to your analysis.
Thanks Dek and Bao for examining this vital area. As someone who works on analysing PNG’s economic history, this is a valuable contribution and I certainly support the conclusions – including extending the same points to other Pacific countries. Three main comments. First, there was a massive break in the GDP series in 2006. The NSO, working with the Australian Bureau of Statistics, used improved methodologies to determine GDP in 2006 was nearly 50% larger than the NSO’s own earlier estimates. Unfortunately, they did not then determine how best to apply this major revision to their earlier numbers (NSO does have earlier figures – they just haven’t been adjusted for the 50% change). Most of the huge variation in the World Bank and UNCTAD series results from no attempt to update earlier figures, while the IMF has (presumably by backcasting former sectoral growth rates to the new sectoral structure of the economy for 2006). Second, as you indicate, the choice of the deflator series can have a major impact. This becomes even more significant when separating PNG’s resource sector from PNG’s non-resource sector. When working with GDP series, especially if trying to determine trends in economic welfare, it is important in a dualistic economy such as PNG to separate out the non-resource sector GDP (so that part of GDP on which 85% of PNG households depend) and arguably apply a deflator reflecting changes in household costs rather than a GDP implicit price deflator. Once again, when looking across the Pacific, there is a real need to carefully consider the appropriate deflator to determine changes in household economic welfare. Thirdly, there are some extraordinary games being played with PNG’s GDP series from 2015 onwards. My conclusion in a blog coming out on the PNG Economics website on 28 January is PNG’s GDP statistics from 2015 have been deliberately corrupted by the current PNG Government. Thanks again for the analysis. Paul