This is the sixth in a series of posts analysing arrivals and departure data in PNG. So far, we have seen that the number of arrivals to PNG has grown enormously over the last decade on account of the country’s economic boom. But tourism is the exception to the rule. Tourist arrivals doubled between 2000 and 2008, but they have since stagnated. Why?
Figure 1 shows the total number of visitors for all purposes, as well as for holidays for the years 1996 to 2013, and the percentage of holidaymakers among all visitors. While the number of overall visitors has increased very rapidly since 2004, linked to PNG’s economic boom, the number of holidaymakers has not recorded a similar increase, instead oscillating around the 25,000 mark in recent years. The number of total holidaymakers peaked in 2008 with 31,103 arriving in the country. This was more than double the 13,792 tourists who arrived in 2000. But since 2008, there has been no increase at all in tourism. In fact, tourist arrival numbers have fallen, reaching 24,013 in 2013. Accordingly, the percentage of holidaymakers among all visitors to PNG fell from over 30% in 1998 to less than 20% since 2009.
Figure 1: number of visitors and % of tourists in PNG, 1996 to 2013
 To explain the stagnating tourist numbers it is useful to break tourists up by nationality as Table 1 (at the end of this post) does. Australia increasingly dominates PNG’s tourist arrivals, with the country’s share increasing from 37% of all tourists to PNG in 2000 to 51% in 2008. The number of Australians has not actually fallen since 2008, it has stayed constant, pushing the share up further to 55%. This pattern is in sharp contrast to PNG’s foreign workforce, which is increasingly Asian.
The total number of Australians holidaying abroad has increased rapidly from about 1.5 million in 2002 to 4.7 million in 2012. There was a slight decrease in 2008 due to the Global Financial Crisis, but strong growth since. Why is PNG losing market share among Australian tourists? One likely reason is the plane crash in August 2009 that killed nine Australians on their way to the Kokoda track – one of the prime destinations for Australian tourists in PNG. The numbers look like Australian tourism to PNG has never recovered from that crash.
Figure 2: number of Australian and non-Australian tourist arrivals in PNG, 2000 to 2012
 Note: Tourist arrivals by nationality are only available to 2012 and are missing for 2006.
Holidaymakers from countries other than Australia have fallen rapidly since 2008, by about 30%. This could be due to a number of reasons: a fall in tourism numbers worldwide from some countries following the GFC; negative publicity from the 2009 plane crash and other incidents; and of course the Dutch Disease that PNG has experienced as a result of the mining boom. PNG’s real exchange rate appreciated by 43% between 2005 and 2013 according to the IMF (2014 Article IV [pdf], p.5). This means that today PNG is a much more expensive place for tourists than it was in the mid-2000s.
Table 1 below gives more detail of tourists by nationality. Some nationalities are up, but many are down. In general, PNG has not been able to take advantage of the growth in Asian tourism. Numbers from China are up, but tiny, while the number of tourists from Japan has collapsed. Filipino and other Asian arrivals are steady.
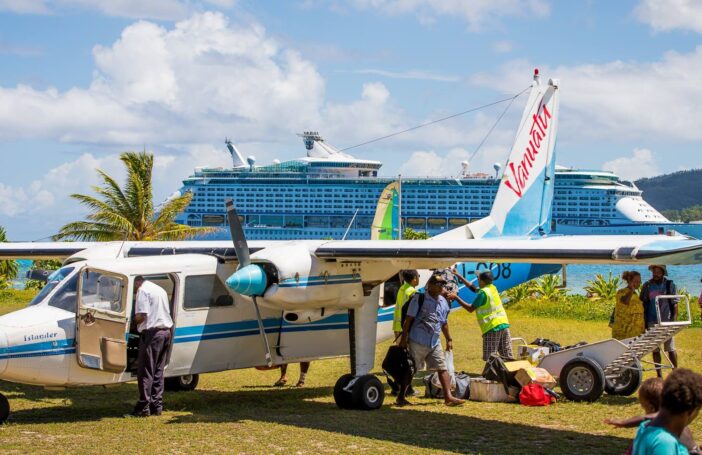
PNG is making fresh efforts to resurrect the tourism industry, and is drawing increased numbers of cruise ship arrivals, and has introduced direct (though expensive) flights between Cairns and Rabaul. The Pacific Games should also give tourism a boost.
While these efforts are to be applauded, what the numbers speak to is the importance of addressing safety and cost if tourism is to become a growth pole for the PNG economy.
Carmen Voigt-Graf is a Fellow at the Development Policy Centre, and a Senior Research Fellow at the National Research Institute in Papua New Guinea. Stephen Howes is the Director of the Development Policy Centre.
Table 1: holidaymakers in PNG by country of residence, 2000, 2008 and 2012


