Papua New Guinea isn’t an easy place to be a sitting MP come election time. Typically, over half of all incumbents who contest their seats lose them.
On the basis of provisional data, 2017 appears to have been kinder on incumbents than usual, but–overall–the difference is slight. With two seats (Chimbu Province and Southern Highlands Province) still to report their results, it looks as if about 48 per cent of of those candidates who defended their seat in 2017 will have done so successfully. This is a bit better than 2012 (44 per cent by my estimate) but not a transformation. Electoral problems and control of DSIP funding do not appear to have made MPs invulnerable.
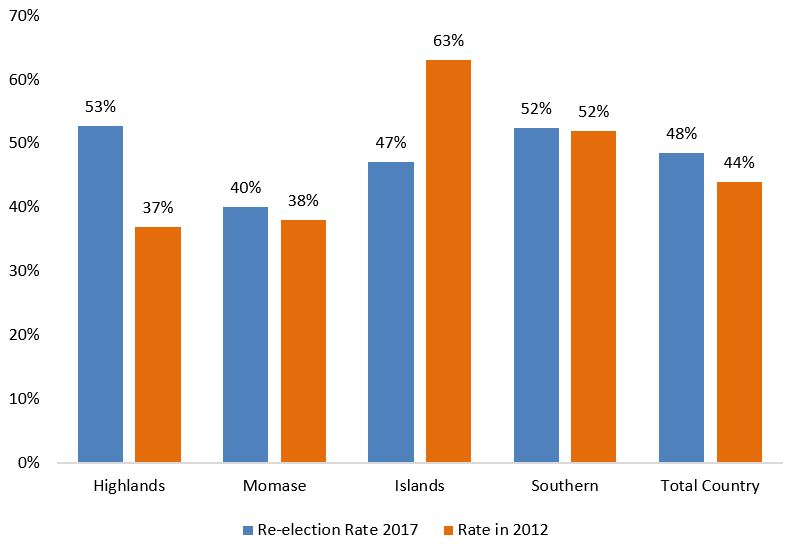
However, there are some interesting regional differences. The incumbent survival rate increased substantially in the Highlands and fell by a similar amount in the Islands region. Given accusations of cheating and other electoral issues in the Highlands, the unusually high incumbent re-election rate in that region is intriguing to say the least, and warrants more study.
The chart below shows incumbent survival rates by region and contrasts them with 2012.
Figure 1: Incumbent survival rates by region, 2012 and 2017
Interestingly, PNC incumbents do not appear to have done particularly well. The chart below compares PNC incumbent success rates with those of all other parties combined, and also independents.
Figure 2: Incumbent success rates by party, 2017

Finally, the survival rate was actually slightly higher for Provincial MPs than Open MPs. This isn’t entirely unusual, but the fact that — the much larger and more fragmented — Provincial seats don’t have much higher turnover rates than open seats has always struck me as surprising.
Figure 3: Open and Provincial incumbent success rates, 2017

You may well have other questions of your own — how did individual parties fare in particular regions, for example? The dataset and many more charts can be downloaded as a spreadsheet here. Please remember there are still two seats to report, there may be legal challenges which change the results in final seats, and while I have taken these data from the best available sources, they may not be perfect.
Terence Wood is a Research Fellow at the Development Policy Centre.