

One of the building blocks of the Australian aid program, or most any aid program for that matter, are country strategies. These documents explain or, in the best case determine, what aid projects are done in which country.
AusAID wasn’t good at getting country strategies out. DFAT produced a whole suite of them in 2015. So important did it regard this effort that it made one of the ten benchmarks for aid program effectiveness (also introduced in 2015) that “all country and regional programs have Aid Investment Plans [AIPs].” Achievement of this goal has been ticked off in successive Annual Aid Performance Reports. But four of the 29 AIPs ran out in June 2018 and another 21 ran out in June of this year. Only four programs have a current AIP – at least that are published. No new AIPs have been produced since 2016.
AIP start and finish dates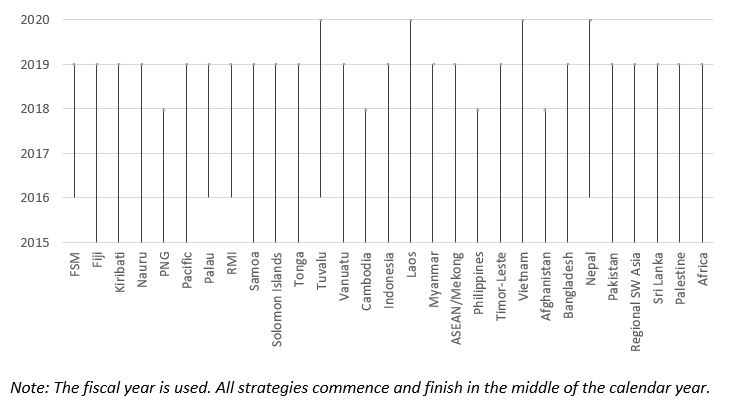
It is doubtful whether country strategies change things on the ground much, but it is surely embarrassing for the government not to have them. Of course, old ones can be rolled over, but the lack of new ones is symptomatic of the current lack of public direction around the aid program.
How the next annual Performance of Australian Aid report will explain the current situation remains to be seen. There was no mention in the most recent one (April of this year) that AIPs had started to expire. The argument had been that tougher benchmarks were needed (as per the Independent Evaluation Committee’s comments on the last Performance of Australian Aid report [Annex B]). But if the current, easy-to-achieve targets aren’t being met, does it make sense to drop them?
In more positive news, Annual Portfolio Performance Reports (APPRs) for 23 countries for 2018-19 are already up on the DFAT website. That’s an impressively quick turnaround, though why the reports for Fiji and the Philippines are missing is unclear. For the last few years, we have conducted an analysis of the achievement of program objectives by country. We’ve updated our graph, which now reflects for most countries five years of judgements.
What the graph below shows is for each country the average proportion over the last five (or in a few cases four) years of objectives which are being fully met (a green rating), as well as the maximum and minimum rating. (These reports use a ‘traffic light’ system to track performance. DFAT rarely gives the worst rating of red to an objective, but does hand out yellow ratings when things are not going well. What the graph below shows is the share of greens.)
Minimum, maximum and average APPR performance scores over five years

The graph shows that most programs have bad years, but do pretty well overall, at least by DFAT’s own reckoning. 18 out of the 25 have at least one year in which half or less of objectives were rated green, but 23 out of 25 have an average performance rating of at least half green. The PNG aid program stands out as the only consistently poor performer. It has a maximum performance level of only one third of its program objectives being met. Its average is 27%, well below the second-worst performer, Pakistan. And of course PNG is no small exception, since it is our largest aid program.
The PNG APPR contains the self-critique (picked up by The Australian’s Ben Packham) that “we are too dependent on capacity building through traditional technical assistance and training modalities.” Sad to say, this is a long-standing criticism of the Australian aid program to PNG. Ten years ago both Australian and PNG governments accepted the recommendations of the 2010 review of Australian aid to PNG, of which one of us (Stephen) was an author. We made the same criticism and suggested (a) less technical assistance and training and (b) more funding for in-line positions. Ten years later, it would seem nothing has changed. For the critique to have any effect and for a significant move to be made to either alternative, the push needs to come from the Minister.
For APPR and AIP data, click here.
Note: The Fiji and Philippines APPRs have now been published, so the second graph now represents five years of data for each country shown.


Thanks Stephen and Sherman for this analytical work on DFAT’s AIPs.
As an Aid worker in DFAT’s bilateral programs in PNG, I have few comments to offer.
AIPs is one of the Aid delivery framework for Australian aid across the globe. However, AIPs is not the only blueprint for successful aid delivery in the recipient nations, there are other factors that also contribute to a success or a failure of an Australian Aid AIPs.
In most cases, AIPs provide an obscured framework in the background and not in the front guiding aid delivery.
Why AIP? AIPs reflect Australia and DFAT aid delivery framework, but the recipient nation’s development framework is another thing that, in most cases may not be complimented with AIPs. This would affect AIPS program delivery in the recipient nations.
Another situation in the recipient nations that may affect AIPs delivery is the political economy trend of the recipient nation. Depending on the recipient nation’s political economy, AIPs could demand more resources than Australia willing to provide in aid.
For example, in your two graphs above; PNG last had an AIP in 2018 (graph 1) and PNG AIP performance level (graph 2) was low at 27 %. This could not only due to the absence of an AIP but could be due to the local political economy situation of the country as well.
Thanks for the comment. Just want to clarify we weren’t trying to make a causal link. Regards, Stephen.