

Papua New Guinea is a resource dependent economy. Much of the resource sector – which makes up 30% of Gross Domestic Product (GDP) – is foreign-owned, and a large share of the benefits flows offshore. For such an economy, Gross Domestic Profit (GDP) is a misleading indicator of national economic activity. Gross National Income (GNI) would be a better aggregate economic indicator, but is unavailable. In such circumstances, the best measure is non-resource GDP (sometimes called “non-mining GDP”), that is, GDP excluding the output of the mining and petroleum sectors, but including their spillover effects (e.g. through taxation and private domestic spending).
Way back in 2016, after surveying the available evidence, we concluded that:
… it is hard to believe that the non-resource economy has not been contracting in 2015 and 2016. Certainly GDP grew in 2015 thanks to strong LNG export growth. But it should not surprise us if the end of the LNG construction phase and the fall in commodity prices led to a contraction in the non-resource economy. Employment, imports, tax revenue and qualitative evidence all seem to point in this direction.
This was written at a time when the only estimates available for non-resource GDP in 2015 and 2016 showed positive albeit weak growth. Late last year, in the 2018 budget, Treasury shows growth of 0.7% in the non-resource sector and overall GDP growth of 10.5% in 2015. But in March this year, the PNG National Statistical Office (NSO) released its 2015 estimate for GDP. The NSO (on its website) now says that real growth in GDP in 2015 was not 10.5% but 5.3%. 2015 was the first full year of LNG production – this resulted in an increase in resource output of almost 50%. NSO has not released its sectoral disaggregation, but it is safe to assume that Treasury’s resource output numbers are correct for 2015: resource GDP is easy to measure as it approximately equals mineral and petroleum exports. Combining the NSO estimate for total GDP with the Treasury estimate for resource GDP gives the result that non-resource GDP declined by 5.9% in 2015 after inflation (see “2018 estimate” in the table below).
Estimates of GDP, resource GDP and non-resource GDP real growth for 2015

Sources: “2017 estimate” from PNG Treasury (2018 budget); “2018 estimate” from NSO. Notes: NSO has only published its estimate for GDP growth in 2015. In the “2018 estimate” row, the Treasury resource GDP figure is combined with the NSO GDP figure to obtain the “NSO & Treasury combined” non-resource GDP growth estimate. All values are in constant prices.
Of course, one cannot be sure of the 5.9% estimate. The IMF estimates resource growth in 2015 at 43.2%. This gives non-resource growth of -4.6%. For several months, the NSO website has said that the detailed tables for 2015 GDP by sector will be published “shortly.” Only release of this data can clear up the uncertainty.
It is hardly surprising that non-resource GDP contracted in 2015. As we noted in our 2016 blog, construction for the mega PNG LNG project finished the year before. That construction, which was carried out over 3-4 years, was valued at $19 billion, which is about equivalent to PNG’s GDP. The removal of that stimulus must have placed significant downward pressure on GDP, both direct and indirect. In addition, 2014 was the year in which government revenue peaked, with revenue falling thereafter partly due to economic contraction but also due to a drop in commodity prices. The resulting fiscal contraction would have also caused a contraction in non-resource GDP.
In addition, and again as we noted in 2016, there were several clear signs of negative growth in 2015: not only falling tax revenue, but plummeting import demand, falling employment, and worrying business accounts of falling sales.
What is more surprising is that this contraction in GDP has taken so long to be recognised in government statistics. The downgrading of GDP growth from 10.5% to 5.3% is not due to a rebasing. In fact, it is not clear what the source for the difference is, other than that one estimate comes from NSO and one from Treasury. Given that NSO receives support from the Australian Bureau of Statistics, the NSO estimates are more credible.
The IMF, the World Bank and the Asian Development Bank (ADB) all missed the severity of the non-resource downturn that is now evident in the official data. The ADB does not report non-resource GDP growth. The IMF and the World Bank do, and their latest 2015 figures do deviate slightly from Treasury estimates. The World Bank and IMF last year reported non-resource sector growth of about -1%, below Treasury’s 0.7%, but well above our estimates of -5 to -6%.
2015 is now a few years ago, and this analysis might seem to be only of historical interest. Far from it; the implications are far-reaching.
First, there has been too much emphasis in PNG economic discussions in recent years on fiscal consolidation, that is, deficit reduction and debt containment. Of course, this is important. But the underlying problem is lack of economic growth. If there had been broader agreement earlier on the 2015 contraction, there might have been more emphasis subsequently on stimulating the economy, in particular through exchange rate depreciation.
Second, if the 2015 Treasury GDP estimates were so off, then their estimates for subsequent years can’t be taken at face value either. The same indicators that suggested a recession in 2015 point to a further contraction in 2016 (as we argued in this 2017 blog). The data for 2017 is more mixed (as we discuss in our latest PNG economic survey). The best recent estimate for economic activity that we have is formal sector employment. As the graph below shows, that in fact started declining in 2013, and has fallen every year since.
Formal sector employment (March 2002=100)
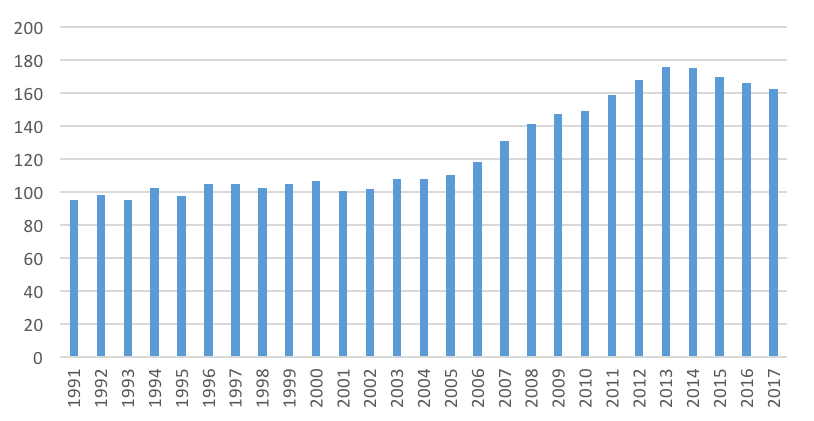
Source: BPNG
Third, the credibility of the World Bank, ADB and IMF is dented. In fact, we shared our 2016 analysis at the time with the World Bank and the ADB: we were ignored by the former, and dismissed by the latter.
Fourth and finally, the Australian Bureau of Statistics provides support through the aid program to the NSO to undertake these GDP computations. That is Australian taxpayers’ money, and it is hardly effective use of that money if 2015 statistics are still not available two and a half years later.
This post is based on the ANU-UPNG “2018 PNG Economic Survey” which was presented at the 2018 PNG Update.


Following publication of the blog, we were actually sent the 2015 NSO sectoral GDP numbers. According to the NSO, resource sector growth in 2015 in constant prices was 39.0% (K15,235 million in 2015 v K10,958 million in 2014), and non-resource growth was -3.1% (K42,764 million in 2015 v K44,122 million in 2014). This is a smaller contraction in the non-resource sector than we had guessed, but still a significant one. According to the NSO, there were major falls in 2015 in manufacturing (-9%), construction (-14.4%) and finance (-14.0). There was positive growth in administrative and support services (+9.7%) and public administration and defence (+5.7%). We hope that the 2016 figures will be released soon.
Stephen Howes and Nelson Atip Nema
Thanks Stephen and Nelson. PNG’s growth performance in recent years has indeed been lamentable (and this is even before considering per capita terms). As you indicate, recognition of the extent of economic crisis could have led to earlier and more appropriate policy actions. Unfortunately, the need for policy corrections is still undermined by PNG Treasury using poor information. Even in the most recent mid-year update (31 July), the Treasury did not update their 2015 GDP figures for those from the NSO (see Chart 13 on p18). They did drop their estimate of 2017 non-resource growth from 1.9% to just 0.2% – politically it would too difficult for them to concede a negative number – so the non-resource sector was still retreating by about 2.9% in per capita terms. The same MYEFO document claims PNG LNG production increased by 15% from 2016 to 2017, and this is part of the basis for a continuing up-beat revenue assessment for the 2018 budget. However, Oil Search on p24 of its 2017 Annual Report states “The Project produced 8.3 MT (gross) of LNG in 2017, up 5% on 2016 levels.” Increasingly, it is difficult to believe the numbers in PNG government documents. This re-enforces the important role for the IMF and other financial institutions to tell it how it is. Their performance in recent years has been disappointing. APEC and talk of new resource projects are a mere distraction to the underlying economic crisis in PNG which requires deep and politically painful changes to policy.
Apparently, the PNG government can get away with this poor growth performance. When is the urban population facing unaffordable housing and monopoly prices going to react? When is the largely rural and mostly uneducated population going to connect the dots?