Writing in 1997, Australian academic Richard Brown noted the “concern that remittances are declining”, and would continue to decline. In fact this pessimism that Brown was observing proved unwarranted. Since the 1990s, remittances to the countries Brown was particularly focused on – Samoa and Tonga – have boomed, as have, even more so, remittances to Fiji.
The graph below shows remittances for Fiji, Samoa and Tonga, going back to 1990, though for Tonga we only have continuous data since 2001. The data is taken from the World Bank and national sources, and the values are shown in constant prices and in US dollars.
Fiji has become the biggest recipient of remittances in the Pacific. It drew in close to US $270 million in 2019. Samoa and Tonga, the next two largest recipients, saw inflows of approximately US $200 million and US $180 million respectively in that year. These volumes are all much more than the US $75 million or so the three countries attracted in 2000.
Remittances into Fiji, Samoa and Tonga (in 2019 constant USD millions)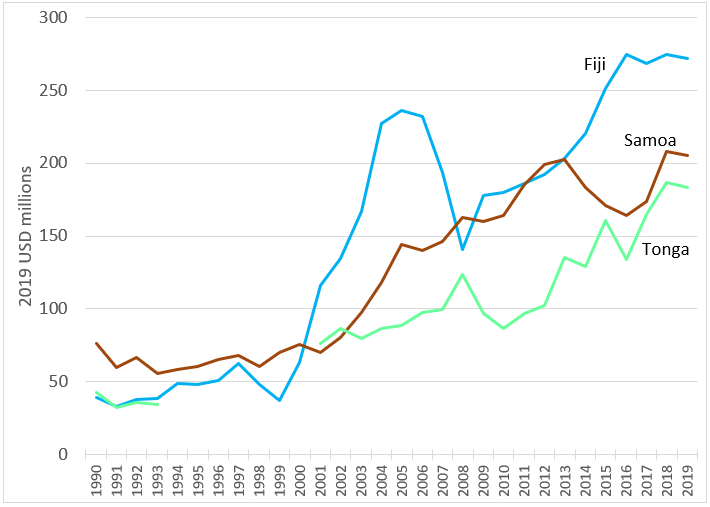
Clearly in all three countries, growth in remittances has been volatile. Remittances exploded in Fiji in 2000, and they almost tripled their value by 2005, before falling over the next few years, and then recovering again. Samoa also saw an acceleration of growth in the 2000s, before a dip in the early 2010s and a subsequent recovery. Remittances fell with the Global Finance Crisis in Tonga, but have recovered since.
Behind the shorter-term ups and downs, however, lies a clear and steep upward trend in remittances. The compound average growth rates for Fiji, Samoa and Tonga between 2000 and 2019 (2001 and 2019 in the case of Tonga) are 8.0%, 5.4% and 5.0% respectively.
But is this apparent boom real? A well-known blog and paper by Michael Clemens and David McKenzie has shown that the global boom in remittances in the 2000s was more artefact than reality. Post 9/11, a crackdown on money laundering led to more remittances being sent through formal channels, and more being recorded. Clemens and McKenzie argue that the actual growth in remittances between 1990 and 2010 was only 40% of the recorded 9.9% annual average.
If this was true of our three countries, then there was no Pacific remittances boom. But it is not. In the figure below, we update the Clemens-McKenzie analysis from 1990-2010 to 2000-2019, since this is our period of interest, and apply it to our three Pacific countries, by decomposing growth in total remittances into growth in the number of migrants (available from the UN – see the data notes below), and growth in remittances per migrant.
Annual average growth in remittances between 2000 and 2019 decomposed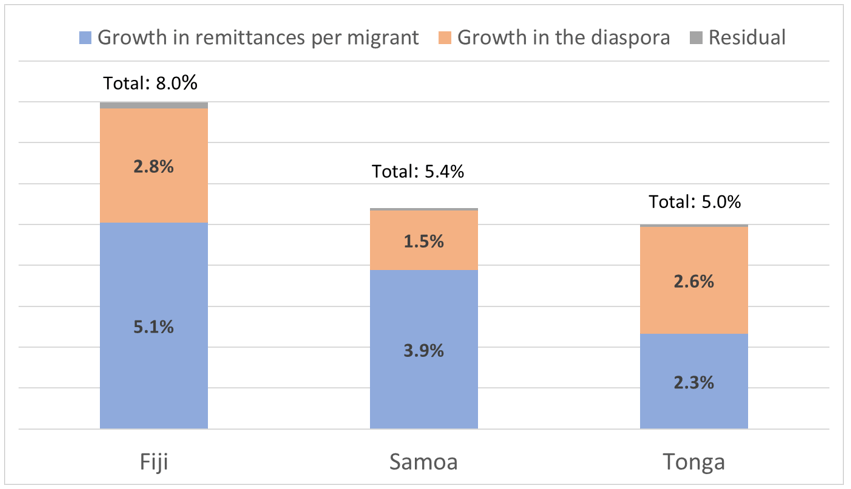
Note the growth in the Pacific migrant stock (diaspora). Fears that rates of migration would fall have not been borne out. There is also strong growth in remittances per migrant. Richard Brown himself, in the article this blog began with, found no evidence of “remittance decay”: the hypothesis that the longer a migrant is away from their country of birth, the less they will remit. But how plausible is this contrary finding of “remittance strengthening”?
To answer this question (for global rather than Pacific remittances), Clemens and McKenzie calculate growth in remittances per migrant on the assumption that remittances per migrant grow at the rate of sending countryGDP. We repeat that exercise for the three Pacific countries. As the table below shows (see the last column), combining this value (instead of recorded per-migrant growth) with growth in the number of migrants explains all of Tonga’s recorded growth in remittances between 2000 and 2019, more than four-fifths of Samoa’s and almost two-thirds of Fiji’s.
Decomposition of 2000-2019 remittances growth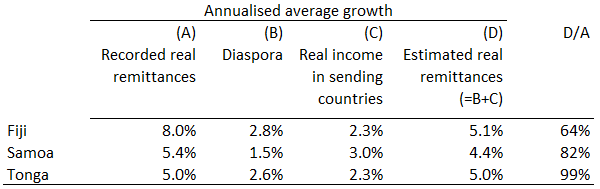
Of course, there is no guarantee that the Clemens-McKenzie method itself gives accurate estimates of actual remittance growth, which is clearly more complex than their method assumes.
That said, the Clemens-McKenzie test is a reality check, and the Pacific numbers pass it pretty well. According to it, average annual remittance growth in our three countries of interest over the last two decades was not 5.4-8% for two decades, but 4.4-5.1%. That is still a boom.
Presumably the reason why more of the recorded Pacific boom in remittances is real than the recorded global boom is that even before 9/11 Pacific economies were quite good at recording remittances. This is perhaps because of the long-standing importance of remittances in the Pacific; and/or because of less use of informal channels to send remittances to begin with.
We focused on Fiji, Samoa and Tonga in this blog precisely because they are the Pacific’s most successful countries in terms of remittance growth over the last twenty years. Obviously, not all countries in the Pacific achieved this rapid growth in remittances. Nor are we arguing that growth in remittances is an unmitigated blessing: in the case of Fiji, for example, the migration underlying that country’s remittances growth in part reflects the country’s military coups.
Rather, our argument is that the examples of Fiji, Samoa and Tonga demonstrate that the remittance pessimism of the 1990s was misplaced, and that sustained, rapid growth in remittances is possible in the Pacific.
Notes:
[1] The UN estimates the number of migrants by deriving the mid-year (1 July) estimate of the number of people living in a country or area other than that in which they were born. If the number of foreign-born was not available, the estimate refers to the number of people living in a country other than that of their citizenship. Data is available every five years from 1990 to 2015, and then for 2019 Source: United Nations, Department of Economic and Social Affairs, Population Division (2013). Trends in International Migrant Stock: The 2013 Revision (United Nations database, POP/DB/MIG/Stock/Rev.2013). See: www.unmigration.org.
[2] Clemens and McKenzie proxied the growth in income earned per migrant with the growth in per capita GDP in the main destination country in which migrants from that country reside. We used the weighted average growth in per capita GDP of the three main destination countries (Australia, New Zealand and the USA) as a proxy. For this calculation, weights are assigned to the GDP per capita of these three countries according to the share of migrants every five years. Using constant or changing weights makes no difference to the results.
[3] All monetary values converted to USD and adjusted for inflation. 1993 to 2019 remittances data for Samoa and Fiji come from their respective central banks. The figures were quoted in local currency units and were converted to US$ using LCU/USD exchange rates and then into 2019 US$ using the US$ GDP deflator index from the World Development Indicators. 1990 t0 1992 remittances data for these two countries and 1990 to 2019 remittances data for Tonga were taken from the World Development Indicators (data missing from 1994 to 2000).
[4] All average growth rates shown are compound annual average growth rates, calculated by comparing the first (2000, but 2001 for Tonga) and the last (2019) year.