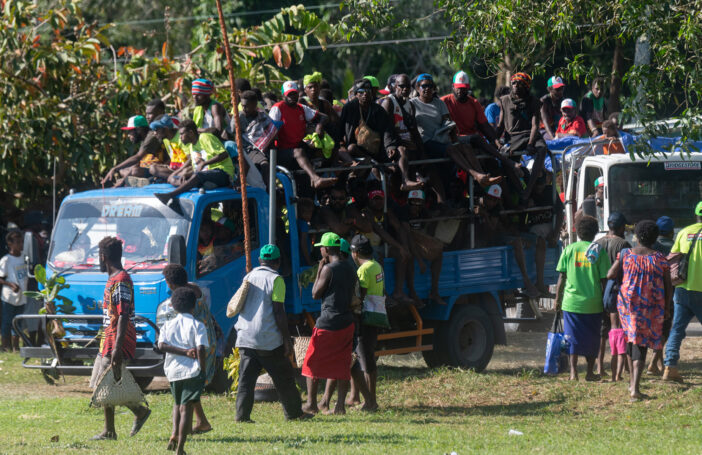
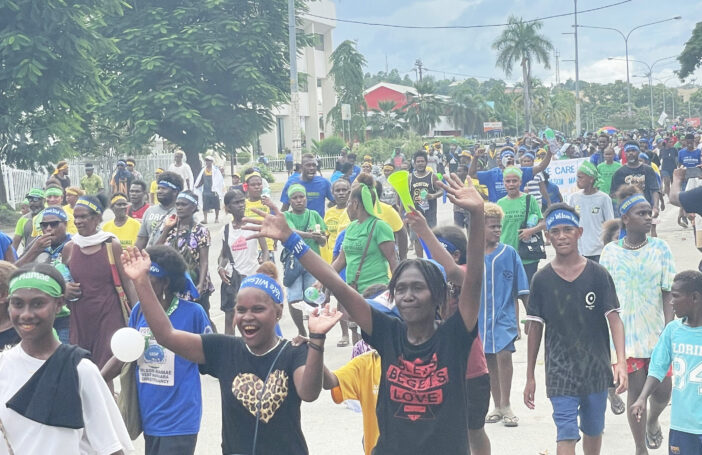
PNG’s 2022 elections have received a lot of publicity, most of it bad, and deservedly so. The electoral roll was clearly out of date, there were bouts of violence, ballot boxes were stolen, and more than one key deadline was missed.
The shortcomings of the electoral process, as important as they are, should not lead us to neglect the results that the 2022 elections have thrown up.
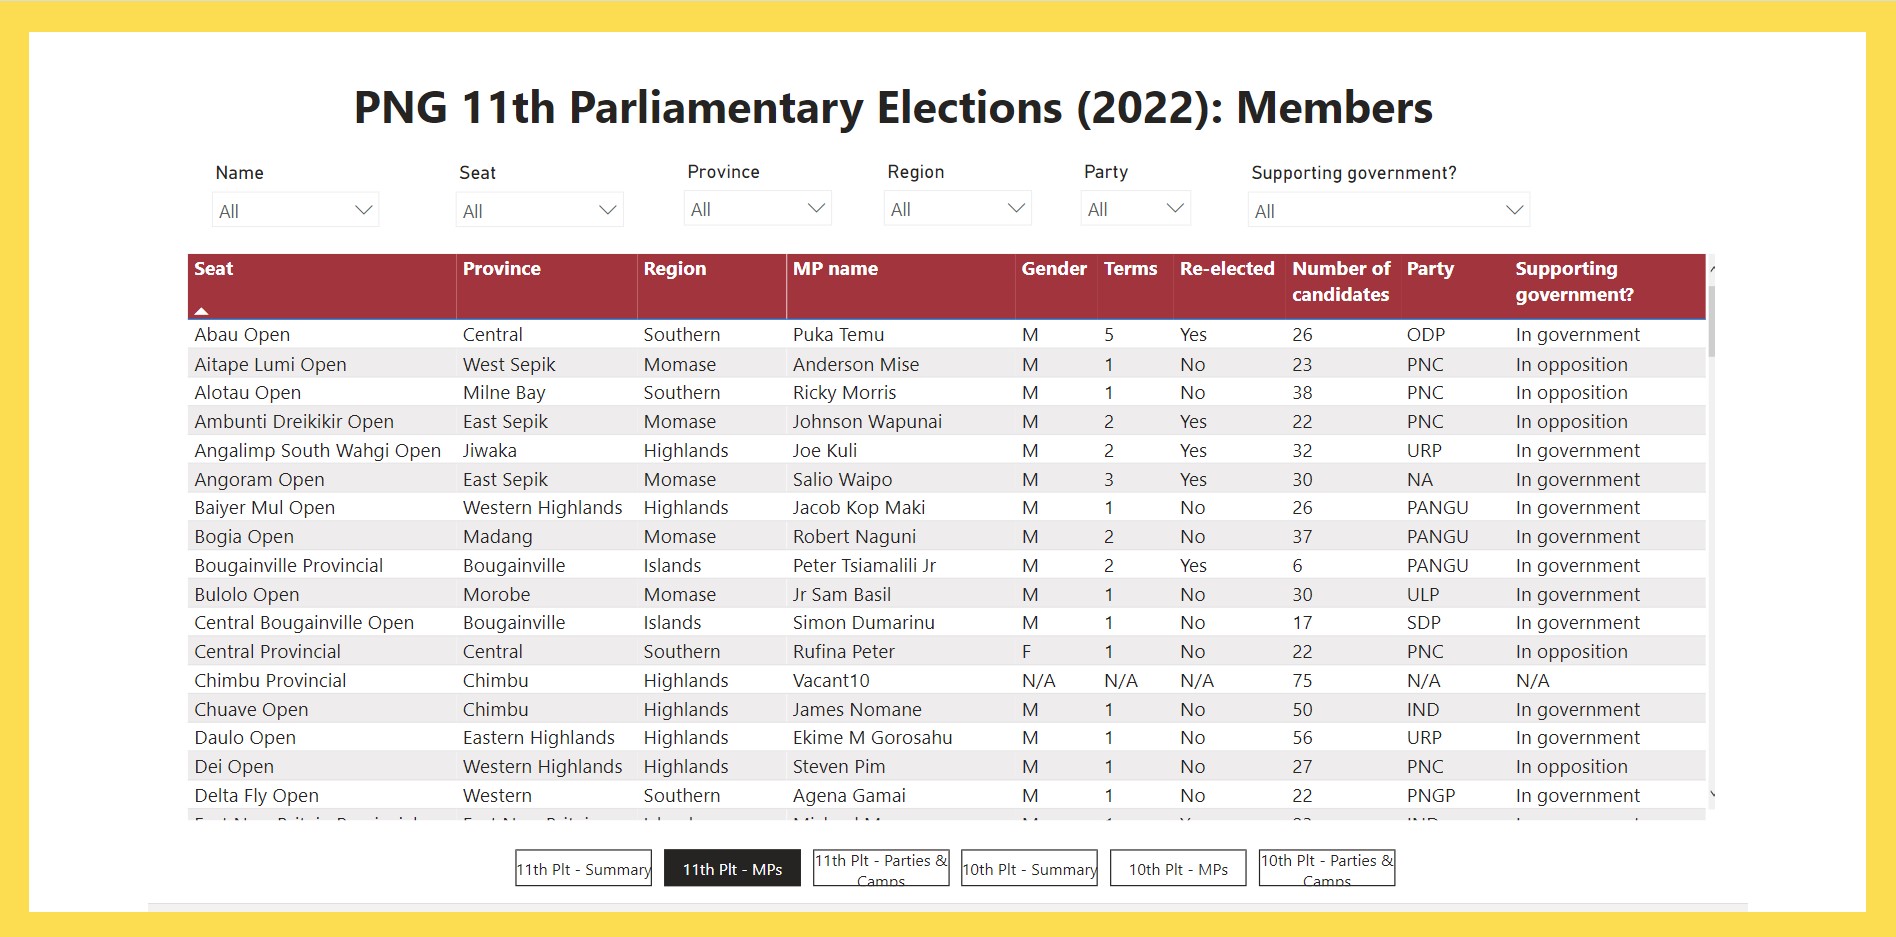
117 seats have now been decided, with elections having apparently been declared failed in one seat. What can we conclude? Here, we highlight nine findings, five to do with parties, and four with MPs.
Parties
1. The election result for PANGU was the second most successful in PNG’s history. The most successful was also PANGU, back in 1982. Then PANGU won 47% of all the seats, but still the 33% this time round is an impressive result.

2. The two major parties both experienced positive swings, and PNC’s swing was actually larger. PNC picked up an additional 31% seats (compared to its number at the end of the last parliament), compared to PANGU’s 22%. These swings exaggerate the two parties’ performance: the number of seats available also went up, with seven new electorates and nine vacancies at the end of the last parliament. Still, both PANGU and PNC did well, and, of the two, PNC did better. But PANGU went into the election with so many more seats that it came out with more as well.

3. Of the smaller parties, the United Resources Party did really well. It almost doubled its seats, from 6 to 11, though note this takes it to just above how it started the 10th parliament, when it had 10 seats. The United Labour Party, on the other hand, lost out, going down from 8 to 3. The National Alliance lost a couple of seats, or rather a couple more: it started the 10th parliament with 15 seats, ended it with 8 and went down to 6.
4. So far 23 parties have been elected to the 11th parliament, compared to 20 at the start of the last parliament and 25 at the end of it. 12 of these are one-MP parties. (See the table at the end of the article.)
5. Independents lost out. 16 independents were elected to the last parliament, but only 10 this time.
MPs
6. There was a significant increase in the incumbency rate. 62% of incumbents were returned, the highest share ever, but still not very high. The splitting of seats helped some incumbents (as they could choose which seat they wanted to compete for), but this does seem like a change. The previous highest was 52%.

7. There was no trend increase in the number of women elected. Although there were no women elected to the last PNG parliament, there have been one, two or three in most parliaments. This time there will be two. That’s better than one or none, but it was disappointing to hear the PM say that the fact that at least one woman was elected proved that no affirmative action was needed. Rather, the fact that only two were elected proves that without affirmative action there will only ever be at most two or three women in the PNG parliament.

8. There was a big increase in number of third-term MPs. This group increased in size from 10 to 23. But the number of first-, second- and fourth-term MPs fell. In this parliament, 37 MPs were elected who have spent at least 10 years in parliament (i.e. more than two terms). In the last elections, only 25 were. 8 MPs were elected who had not been in the last parliament, but had been MPs before – a significant number of non-incumbent but rather ‘recycled’ MPs.

9. Incumbents and more experienced MPs got declared earlier. We were tracking results daily. The first result was announced on 15 July, and the most recent on 25 August. The graph below plots the declarations – now close to but still not at 100%. It also shows that more experienced MPs tended to be declared earlier, so that over the declaration period the average tenure of MPs fell (from 4 to 2 terms). Incumbents also tended to be declared earlier so that the share of declared MPs who were returned also fell from 100% to 50%. Presumably the more successful MPs win more easily, which also gives them a greater say in government formation (though this time PANGU’s success made this process much smoother than usual).

Analysis
There was a lot of electoral fraud and PANGU did very well. It is tempting to conclude that there must have been a causal relationship, and that PANGU, which went into the election as the leading party of government, engineered the electoral fraud to its advantage. The problem with this explanation is that PANGU’s main rival, PNC, had a bigger swing than PANGU did. Based on this, it seems more reasonable to conclude – as some of us have argued – that, while widespread, the electoral fraud was more locally than nationally directed.
Why then did PANGU do so well? PNC went into the 2017 elections with 55 members, and came out with only 29. The main reason PANGU did so much better in 2022 than PNC did in 2017 is that so many of PANGU’s MPs were re-elected: 24 out of 32 or 75%. Compare this to PNC’s 5 out of 13, and the overall incumbency rate of 61%. PANGU also attracted another 5 MPs who succeeded in running under a PANGU banner; PNC only attracted 2. In terms of new candidates, PANGU and PNC did equally well – 10 each. PANGU’s (or Marape’s) strength at the elections was their ability during the last parliament to attract electorally popular MPs.
Finally, this is the fourth election in a row in which the incumbent PM has been returned. Given that, Marape’s return isn’t surprising, even if the extent of his victory is. We explained before the elections how PNG’s political system (unintentionally) embeds an incumbency bias: during the life of the parliament, MPs flock to the party of the PM, and so that party goes into the elections by far the biggest, and so will probably emerge as the biggest too, making it almost certain that it will be called on by the Governor-General under S63 of the political parties law (OLIPPAC) to form a governing coalition.
If you can’t remove a PM through the electoral system, MPs will try all the harder to do so through a mid-term vote of no confidence. How to change this isn’t clear (Marape in his inaugural speech mooted a change to a presidential system), but something needs to be done – as it does about the meagre political representation of women.

This blog is based on the ANU-UPNG PNG MP Database. It was revised on 31 August and 5 September to reflect results and to correct a few errors. 117 seats have been declared. In one electorate (Lagaip Open), the election has been reported to have failed. One MP has sadly died, but is nevertheless included in the analysis. The incumbency rate is defined as the number of incumbents returned divided by the number who competed (not necessarily in their own seat).


Results of few other parties needs to be verified properly before you put up for publications. For instance, Social Democratic Party won four seats in the election, not 3 as per stressed above.
A quick note on the fact that successful incumbents tended to be reelected earlier than challengers.
I looked at this more & there are very clear relationships between:
(1) the number of candidates and the probability an incumbent will be reelected. (The Hegarty rule).
(2) the number of candidates and the time taken for votes to be counted.
This suggests a possible explanation for the — otherwise suspicious looking — finding that reelected incumbents tended to be declared earlier: usually when sitting MPs are reelected they do so in races with fewer candidates (1 above). And counting is more rapid in races with fewer candidates (2 above).
So the relationship between incumbent victory and time for results to come in stems from the average number of candidates being higher in races where new MPs are elected (and incumbents lose their seats).
I checked this empirically, and when candidate numbers are controlled for, incumbent re-election ceases to be correlated with number of days until results came in.
Terence
Would be interesting to know from the panel the need to review the current LPV voting to explore a full exhaustive LPV counting leaving the LAST MAN to stand or declared! This will allow all preferences from voters allowed to be counted not leaving behind a preference cast by voter.
Thank you for the comment and suggestion.
It is a very interesting proposal. It seems to me there would be two associated challenges: increased counting time, and increased complexity for voters, who would have to fully rank candidates by preference (as I understand it).
Both of these challenges seem like major impediments that would need to be planned for and overcome.
Thank you again for your comment.
Terence