The first blog in this series looked at the economic damage being done by COVID-19 to the countries of the Pacific, including PNG and Timor-Leste. In this blog, we look at how much the governments of these countries are spending to combat this damage, and how they are financing that new expenditure.
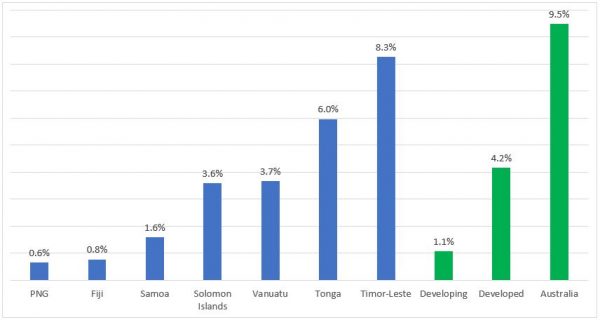
The additional government expenditure announced (typically in April) as part of their COVID-19 response or stimulus by the seven regional governments covered in our new Pacific Covid Economic Database is shown below. The figures include both health and non-health spending (such as to boost food security or strengthen safety nets). They only include extra planned government spending: private sector contributions (such as early access to super funds) are excluded. For comparison, the average size of fiscal support packages put forward by developing and developed countries around the world (from the International Growth Centre) and Australia’s own COVID spend are also shown.
Additional expenditure in response to COVID-19 (% of GDP) 
Source: Pacific Covid Economic Database
There are two striking things about this figure. First, Pacific countries put together much larger funding packages than the average developing country. Second, there is a very wide range.
More is not necessarily better. Some spending packages are more comprehensive and have a shorter duration than others. (We have excluded any subsequent announcements made after the first support package was announced.) Additional spending is also not a good proxy for government stimulus. Governments might stimulate their economies in ways other than spending, for example by cutting taxes or getting banks to lend more. At the same time, a COVID spend financed by expenditure cuts elsewhere is not much of a stimulus at all.
Nevertheless, the wide range and high average are certainly of interest. There could be any number of political explanations. But you have to have money to spend it. How is this additional spending being financed?
Our answers are based on governments’ own documentation, either at the time of the stimulus package, or as revealed subsequently. The information is not fully comparable across countries, but some interesting patterns nevertheless emerge.
First, countries that have access to reserves or rainy-day funds are fortunate relative to those that lack them. Timor-Leste has a US$17 billion oil-financed sovereign wealth fund; that’s ten times the value of its GDP. You wouldn’t want to use it all at once, but it does mean Timor-Leste can fund as much spending in the short term as it wants.
Vanuatu has been running budget surpluses for the last few years, financed by the sale of a modified form of citizenship, which has become the government’s biggest revenue earner. Some of this has been used to prepay debt, but much has been used to build up cash reserves. Passports aren’t going to earn you as much as oil, but the cumulative value of the fiscal surpluses for the last three years is about US$70 million (8% of GDP), and Vanuatu was planning to add another US$28 million this year. This is ample to finance the US$37 million in extra spending Vanuatu has proposed in response to COVID-19.
While we don’t cover most of the Pacific countries that are heavily dependent on revenue from fishing fees in our database, the surge in such fees over the last few years has meant that they have also been running large fiscal surpluses in recent years (see the last figure in the first blog). Kiribati and Tuvalu also have sizeable sovereign wealth funds to draw on: the Kiribati Revenue Equalization Reserve Fund is currently valued at A$1.14 billion (six times GDP) and the Tuvalu Trust Fund at A$179 million (in 2018) or four times GDP.
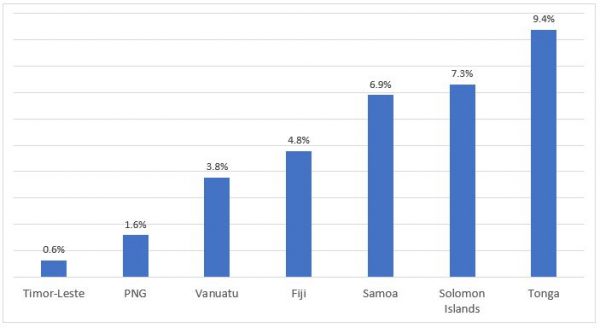
Second, all Pacific countries have access to donor funds: as noted in the first blog, the Pacific is the most aid-dependent region in the world. The figure below shows our estimate of the additional external assistance provided to these countries since the pandemic arrived (up to 12 August 2020). The figures include grant aid, and both concessional and non-concessional official lending.
External assistance in response to COVID-19 (% of GDP)
Source: Pacific Covid Economic Database
Timor-Leste has missed out perhaps because of its oil and PNG has been disadvantaged by its size, but the other countries have done comparatively well in terms of donor support. All countries have actually received more aid than they assumed at the time of their stimulus announcement. But not all external assistance is available for additional spending. Most of Fiji’s is in the form of budget support, and is being used to support existing expenditure, given its severe revenue shortfall (28%).
A third way to fund additional spending is to borrow more. Most Pacific countries are, but most in moderation. Fiji is stretching its borrowing capacity to the limit, largely to make up for a 28% decline in own revenue. PNG, like Fiji, went into the year with a deficit, and also faces borrowing constraints and a large revenue shortfall. In April, the government successfully placed a K2 billion COVID-19 bond. However, PNG’s pre-COVID deficit target was already 5% of GDP. We are sceptical that PNG will be able to borrow more than that amount over the year, but we will learn more once the country’s mid-year fiscal outlook is released.
The final choice open to countries that want to spend more on COVID is to spend less on other things. Some of this will happen naturally (through savings on travel and delayed capital projects), and some is a reprioritisation. This has been less publicised, but widely done. For example, Solomon Islands’ expenditure savings are about half of its COVID funding, and Fiji’s four times. Major expenditure savings are also expected in PNG, due to its large revenue shortfall, though they have not yet been announced.
To summarise, we can classify the seven countries into three groups, as per the table below. The “self-funded” group of Timor-Leste and Vanuatu have paid for their COVID spend out of government reserves: they are the least constrained and have the highest average spend. The “aid-financed” group of Samoa, Solomon Islands and Tonga have largely matched their COVID spend to their external assistance. The “constrained” group of PNG and Fiji have neither reserves to draw on nor significant foreign grants, and are suffering from a combination of limited borrowing capacity and a loss of revenue.
How countries have financed their COVID spend (% GDP)
Notes at the end of the blog.
These same considerations explain why on average the Pacific response has been more generous than that of the average developing country: on average, better starting points and more generous donor support have more than offset the disadvantages of constrained borrowing and revenue shortfalls. Returning to the first figure, PNG and Fiji emerge as typical by the standards of developing countries, but exceptional as Pacific nations.
In the next blog we look at what countries have been spending their additional COVID expenditure on.
More details on the figures and sources available at the Pacific Covid Economic Database. For the last table: PNG is assumed not to benefit from additional grant or loan financing beyond what is in the budget – to the extent that it does, it will need lower expenditure savings; the breakdown between domestic and external borrowing is not available for Fiji; Solomon Islands plans for a surplus relative to announced pandemic funding and spending; missing values for Timor-Leste and Vanuatu reflects the fact that their COVID spends are fully funded by reserves, and do not imply the countries are not receiving additional aid, or not suffering a revenue shortfall; expenditure savings are either stated or deduced; external assistance is as per the funding announcement, not as per actuals to date.
This is the second blog in the Pacific Covid Economic Database series. You can find the first blog here, third blog here, and fourth blog here. It is also part of the #COVID-19 and the Pacific series.


Leave a Comment