

In a previous post, I discussed how provincial revenue in PNG has performed over time, how inequitably it is distributed, and how inadequate it is given aspirations for provincial autonomy. Here I discuss how subnational government — provincial, district and local level government (LLG) — spending has evolved over time, and the problems subnational governments face in accessing funds.
The focus of this post is on subnational spending reported by and paid for by the national government. The national government pays the salaries of provincial public servants directly. It also transfers funds every year through what are called “function grants” for non-salary operational expenditure or “service delivery costs” earmarked for specific spending areas such as health and education. And the central government funds projects through Service Improvement Program (SIP) expenditure. Taken together, these expenditures make up subnational government spending. Excluded are the revenues raised by subnational governments themselves (discussed in the previous post). Port Moresby (the National Capital District) and Bougainville are mainly excluded from the analysis as these provinces are not part of the Intergovernmental Financing Arrangement.
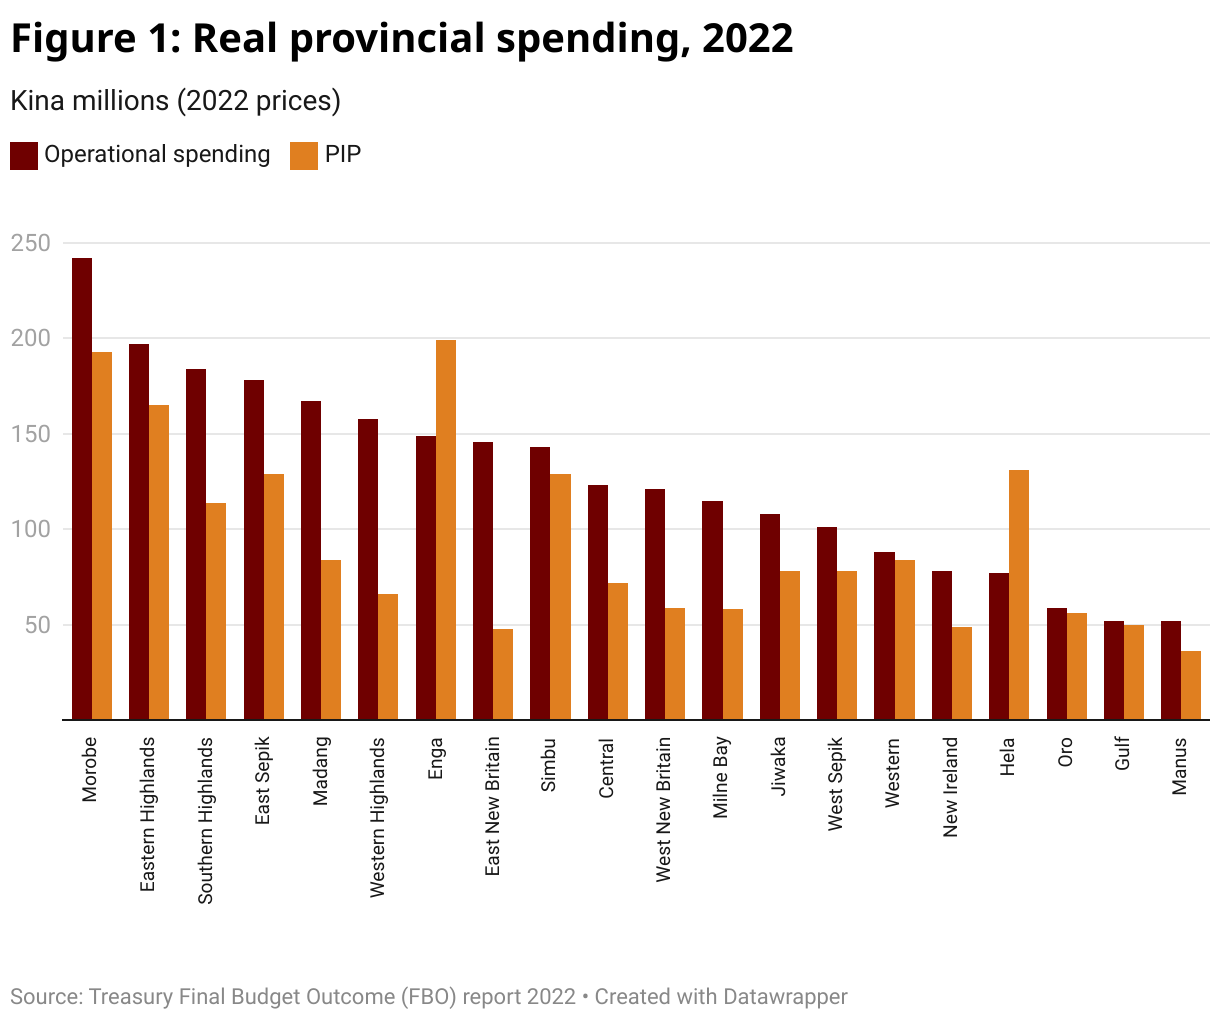
Real (adjusted for inflation) PNG spending at the subnational level was K4.9 billion in 2022. This is one fifth of national government expenditure. Of this, operational spending was K2.7 billion and capital spending through government’s Public Investment Program (PIP) at the subnational level was K2.2 billion. This K4.9 billion that is financed by the national government greatly exceeds the K0.6 billion that provinces raise through the GST and other own-source revenues.
Morobe had the highest combined spending (K434 million) in 2022, while Manus (K88 million) had the lowest. These figures are consistent with population sizes, as Morobe is the most populous province and likely had the highest operational costs, while Manus is the least populous. In Enga and Hela, capital spending exceeded operational spending.
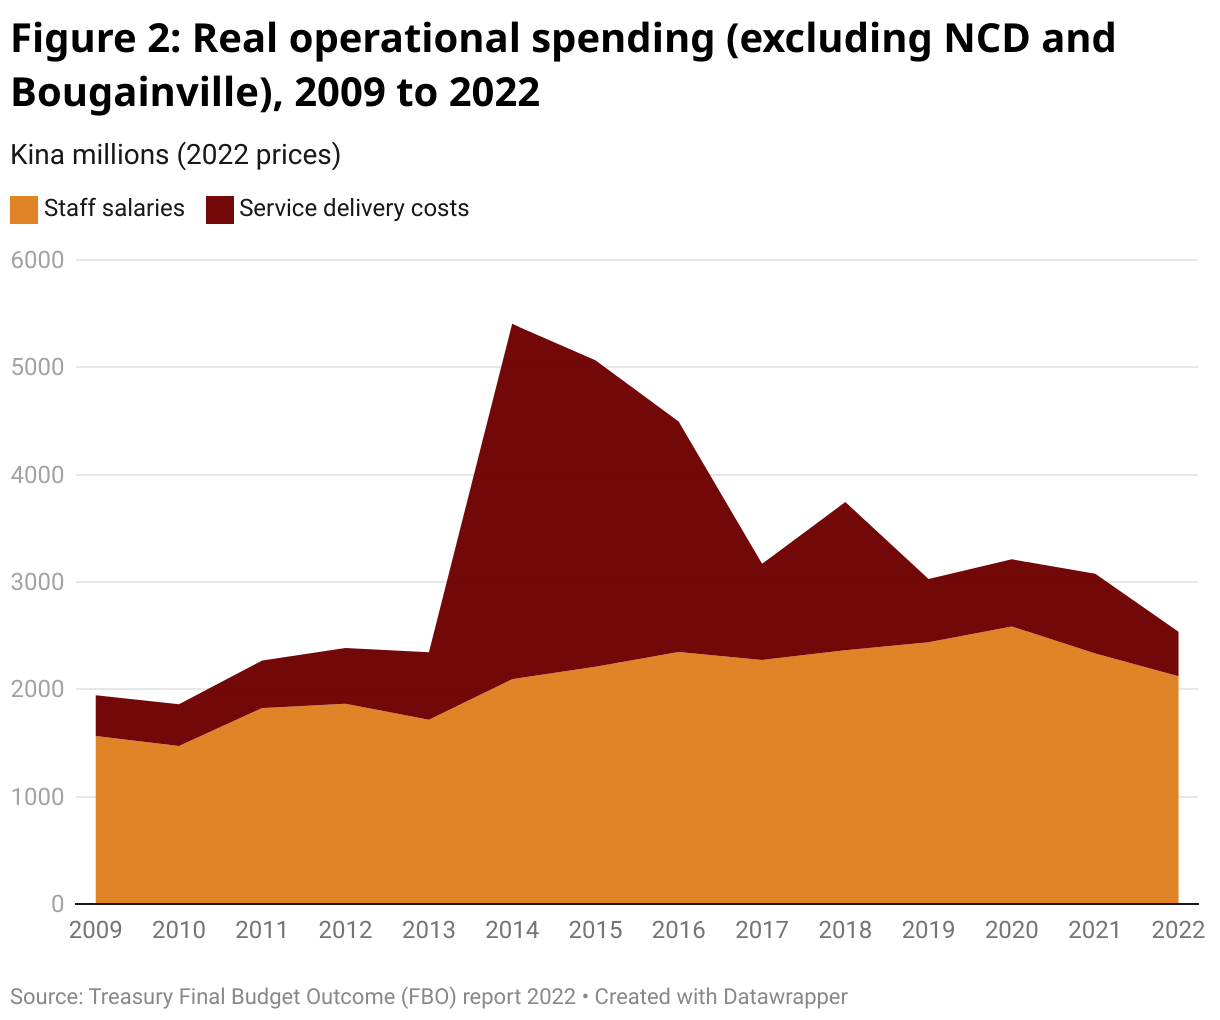
Real operational spending has been volatile over time, and is much lower now than it was in 2014. The 2014 bump in operational spending reflected a ramping up of national government spending which turned out to be unsustainable as commodity prices fell in subsequent years. The fall in operational spending after 2018 is partly a result of the introduction of Provincial Health Authorities (PHAs), which removed health as a responsibility of provincial administrations. Operational spending has continued to fall since 2020, as has provincial revenue as discussed in the previous post.
Within operational spending, staff salaries was the largest spending area for provinces except in 2014 and 2015. Staff salaries are managed centrally by the national government, while service delivery spending is a responsibility devolved to the provinces since 1977. Between 2009 and 2022, staff salaries averaged 69% of operational spending, with service delivery accounting for the remainder. Although staff are important in delivering services, the World Bank found that spending on government staff has consistently exceeded budgeted levels since 2010. The excessive spending on staff and the volatility in serving delivery spending levels have contributed to failures in delivering essential services like road maintenance.
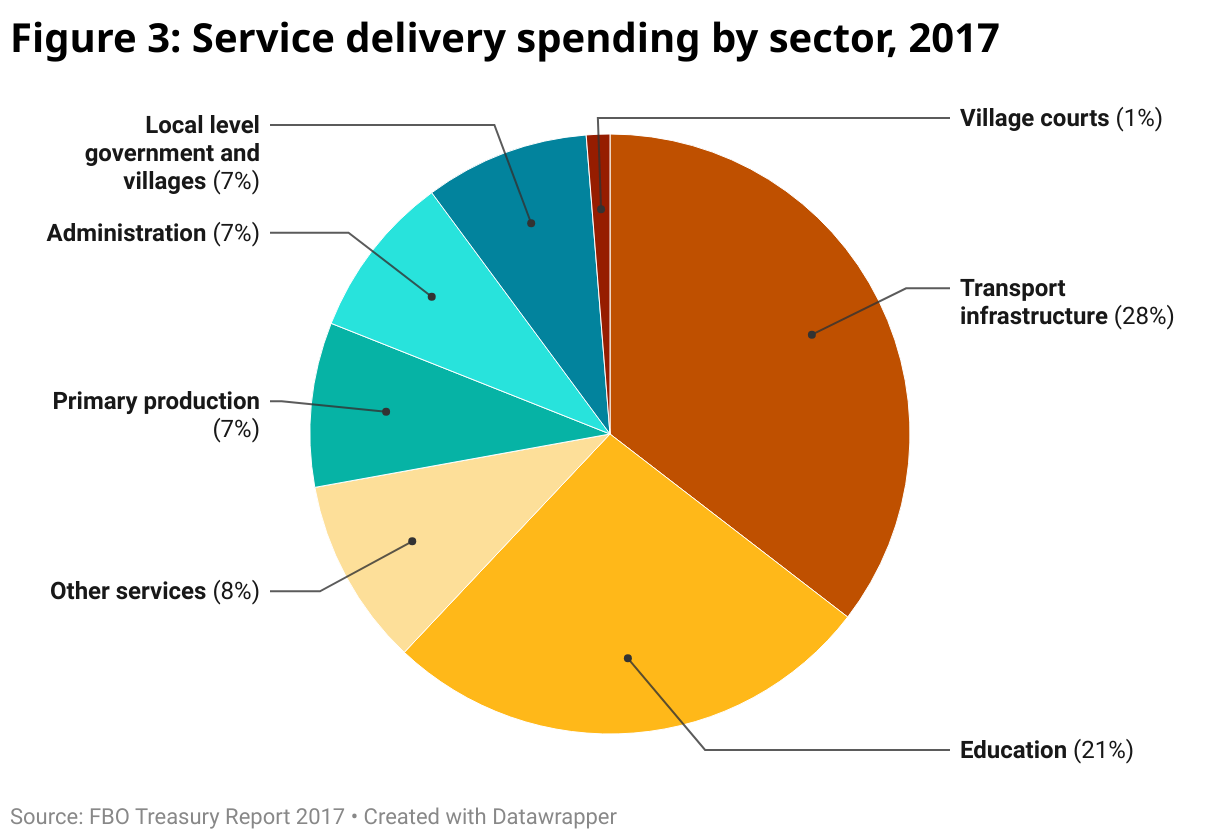
Real service delivery costs in 2022 amounted to K445 million. Service delivery covers all spending areas — though, since 2018, some health funding has gone to PHAs. By 2018, Morobe and New Ireland’s revenue exceeded their service delivery costs, so they ceased receiving function grants from the national government. Prior to 2018, the largest components of provincial spending were transport infrastructure, education, and health. (This is a positive as these align with PNG’s development goals.)
Capital spending under the government’s PIP is another large spending area for provincial and district governments. The subnational PIP has two main streams. The first is for specific projects undertaken by the national government in consultation with the provinces. The second is the SIP, consisting of funds to be spent at the discretion of provincial and district members of parliament. The PIP for subnational governments was spent on specific projects (51%), 39% on district SIP (DSIP) projects, and 10% on provincial SIP (PSIP) projects. The increase in SIP funding to a level where it constitutes half of subnational capital spending is worrying given the poor governance surrounding it.
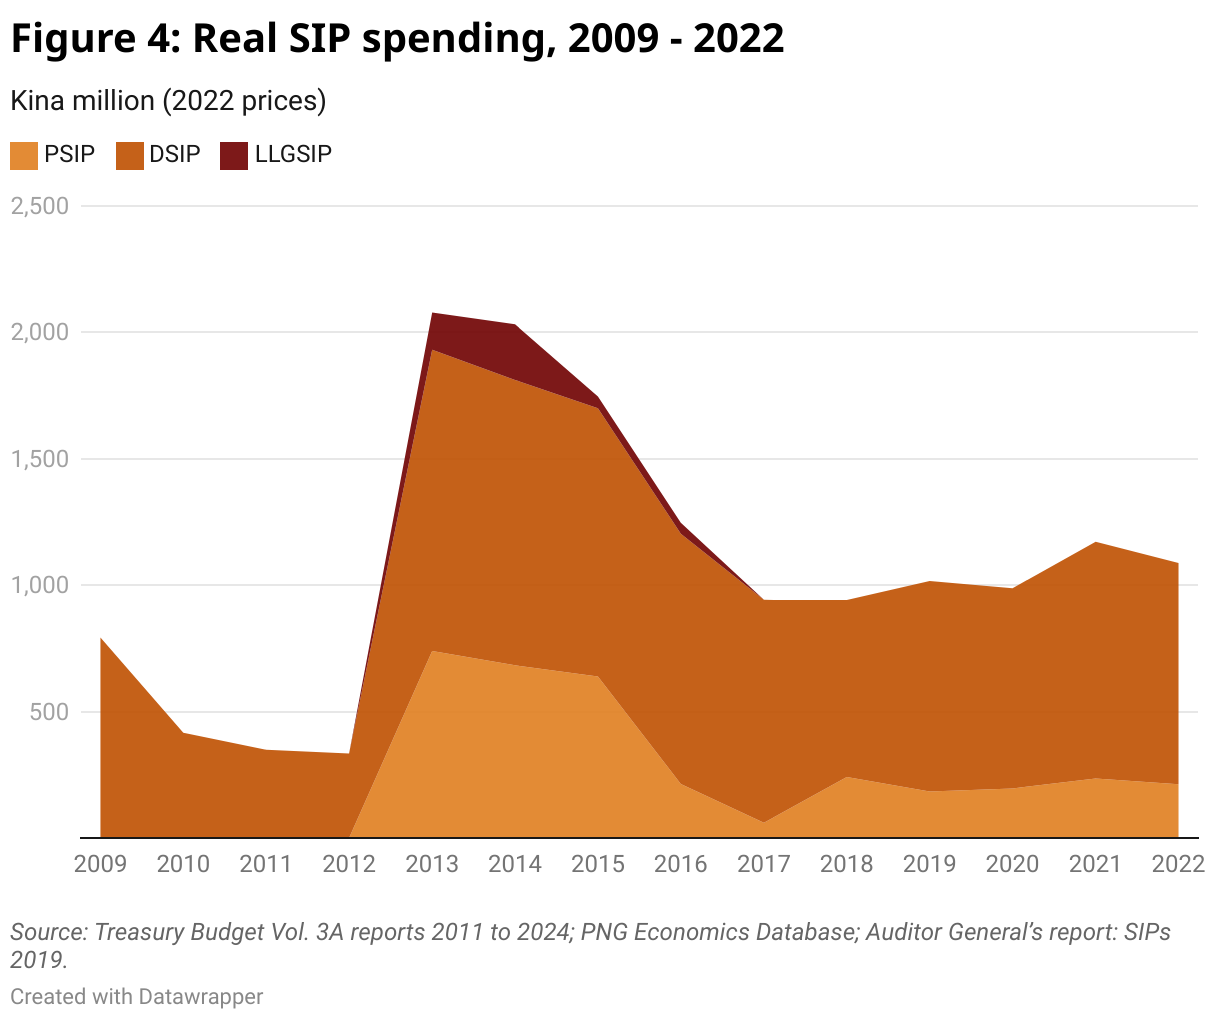
It is easier to track SIP funding over time, as information on this is available whereas information on the broader subnational PIP isn’t available for years prior to 2020. SIP funding has been volatile since 2009, increasing sharply in 2013 when provincial and LLG SIP funds were introduced. PSIP funds were initially set at a nominal K5 million per district, but were reduced to DSIP funding levels in 2016 after national government revenue collapsed in 2015. During its brief existence, LLG SIP funding averaged K229,093 per LLG. Since 2013, DSIP funding has averaged three-quarters of the total annual SIP budget, with PSIP funding accounting for the remainder.
Although we refer to function and SIP grants as spending, since eventually they must be spent, what is recorded here are the transfers to subnational governments. There are significant provincial bank balances indicating that not all funds are in fact spent in the year in which they are received. For example, the disbursement of function grants is often delayed, with analysis showing that provinces receive 90% in the second half of the year. While waiting for funding, provinces often revert to relying on their own revenue and the roll-over of function grants from the previous year. This increases the risk that funds will not be used for legislated functions.
In conclusion, operational spending has been volatile and in decline since the boom. Service delivery has also become haphazard owing to delays in accessing function grants. In addition, half of all subnational capital spending has weak oversight.
The Papua New Guinea’s fiscal decentralisation: A way forward report is available on the Lowy Institute website. This report is part of the Lowy Institute’s Pacific Fellow Project, funded by the Foundation for Development Cooperation (FDC), and was undertaken while the author was the inaugural FDC Pacific Fellow at the Lowy Institute.
This is the second blog in a three-part series on fiscal decentralisation.
Data from the three blogs is available at the PNG Budget Database.


Can you explain where does the LLGSIP come from? Is it from the PSIP, DSIP or national government?