

In mid-September, the Center for Global Development released the latest iteration of its Commitment to Development Index. The index ostensibly measures wealthier countries’ commitment to improving our planet. Commitment is measured across areas ranging from aid to trade.
This year the index brought a surprise: New Zealand was ranked first in the world for the quality of its aid. New Zealand’s not a generous giver, which pulled its overall aid score down but, in the words of the Center for Global Development, “what New Zealand lacks in quantity, it makes up in quality”.
Normally, like most New Zealanders, when I hear we’re the best at the world in anything, I don’t ask questions. But this time, I made an exception. The New Zealand Aid Programme has some excellent staff, and is operating in a kinder political environment these days, but it suffered nearly a decade of misrule. It would be surprising if New Zealand was giving the best aid on earth.
So I had a look.
The Commitment for Development Index’s aid quality score comes from another source produced by the Center for Global Development: the Quality of ODA dataset (QuODA). Each country’s Commitment to Development Index aid quality score combines the QuODA scores of the multilateral organisations the country gives aid to and the country’s own national QuODA score. New Zealand’s not a particularly generous multilateral donor, which meant its Commitment to Development Index aid quality score was driven first and foremost by its own national QuODA score. It’s that score I’m going to focus on here.
Countries’ national QuODA scores are calculated by taking the mean of their performance across 24 individual indicators. As my former colleague Camilla Burkot discovered last year, QuODA data weren’t updated between 2012 and 2017. They were updated in 2018, however; and the QuODA methodology was modified somewhat. The 2018 data are here. The 2018 QuODA scores are based on 2016 aid data. The last time QuODA data were updated, New Zealand’s aid quality ranking was seventh. For the most part, subsequent improvement wasn’t caused by other donors scoring worse; New Zealand’s score improved. I’ll return to this point.
The cause of New Zealand’s world-beating 2018 performance can be seen in the chart below. It’s a histogram of all donors’ scores for all 24 indicators. Other donors are shown in grey. New Zealand is shown in red.
The histogram shows that most donors scored close to the average (which is zero on the x-axis) for most indicators. New Zealand was like this too, most of the time. However, it scored exceptionally well on two indicators. This, in short, was the secret of its success.
New Zealand ended up first for four reasons: (1) each donor’s overall QuODA aid quality score was the mean of its scores across all indicators; (2) New Zealand scored exceptionally well on two individual indicators; (3) means are sensitive to outliers; and (4) most donors were close to average most of the time.
Histogram of donors 2018 QuODA indicator scores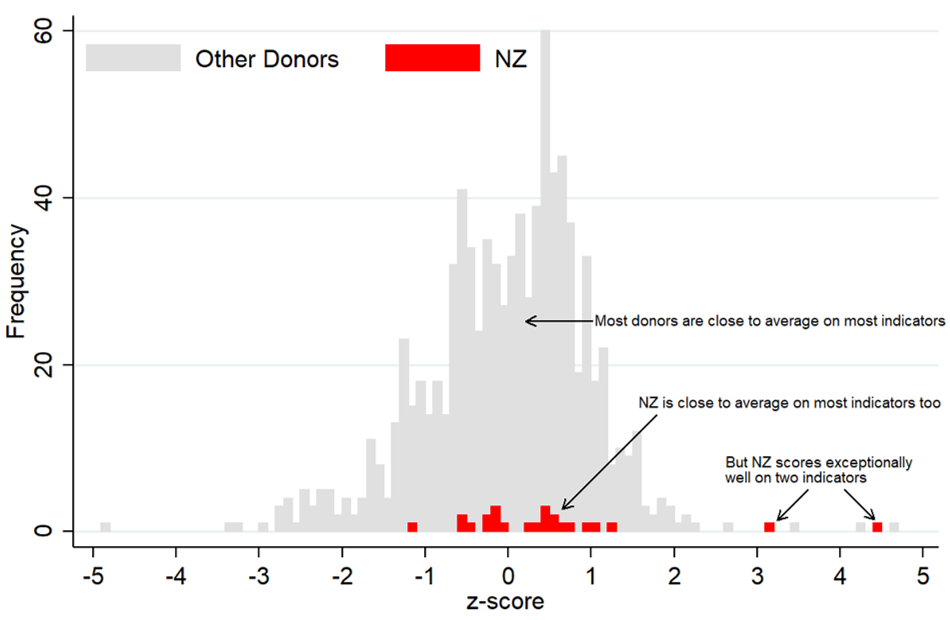
Had New Zealand’s score been average, rather than exceptional, for the two indicators it scored so well on, its rank would have fallen to sixth of the 27 countries covered.
The indicators New Zealand scored well on were: share of aid to well-governed countries and significance of aid relationships (its best score).
The ‘aid to well-governed countries’ indicator is calculated by taking the share of a donor’s total country programmable aid a recipient receives and multiplying it by a measure of quality of governance derived from the World Bank’s World Governance Indicators. Then, for each donor, the calculated scores for all of their recipients are added together to produce a single donor score. (For more, read the Center for Global Development’s methods here.) Donors are scored higher for giving more aid to better-governed countries because it’s thought that aid is more likely to work in these countries.
In 2016, the top eight recipients of country programmable aid from New Zealand were Pacific island countries. Together they received 61 per cent of the country programmable aid New Zealand gave. There’s no governance data for two of these countries: Tokelau and Cook Islands. Four of the other six countries were among the best-governed 20 per cent of aid recipient countries in the eyes of the World Bank. Only one country (PNG) was in the bottom half of recipient countries.
New Zealand scores so well on the aid to well-governed countries indicator for a simple reason: we focus on the Pacific.
The Pacific is also why New Zealand does so well on the ‘significance of aid relationships’ indicator. This indicator doesn’t quite do what the name suggests: it isn’t a measure of how much effort a donor puts into managing relationships with aid recipients. Rather, it measures the extent to which a donor contributes to donor fragmentation in recipient countries. To simplify slightly: donors that give aid to countries where there are lots of other donors score poorly, donors that give aid to countries were there are few other donors score well. Pacific countries are generally dominated by a small number of donors. And so New Zealand scores well again.
As best I can tell on the basis of very limited information, New Zealand’s improvement since 2012 has come about mostly due to methodological changes. (One being that there are fewer indicators now, so scoring well on two of them matters more.)
Most members of the New Zealand aid community (me included) think it’s great that New Zealand focuses on the Pacific. But it’s hard to claim that New Zealand is the best donor on earth simply because it’s focused on the Pacific. New Zealand didn’t choose to focus on the Pacific because governance is good there, or because other donors are ignoring it. Its Pacific focus comes from historical ties and geographical proximity.
New Zealand’s odd performance doesn’t mean the QuODA index is garbage. Although the Commitment to Development Index extracts a singular score of aid quality from QuODA, QuODA’s own methodological notes caution against doing this. QuODA is useful, but it needs to be interpreted carefully.
As for New Zealanders: alas, it is too soon to start gloating about our world-beating Aid Programme. Maybe in coming years…
Note: I am very grateful to Center for Global Development staff for replying helpfully when I emailed them. I’m also grateful to Camilla Burkot for last year’s blog on QuODA, which made this easier to write. In 2016, another former colleague, Robin Davies, critiqued Australia’s Commitment to Development Migration ranking in this blog.


Thanks Murray,
Good comment. I think you’re quite right to conclude that ‘good’ as measured by the types of indicators of practice that one can compile in an international dataset, and good as measured by actual positive impacts on the ground, are quite different things.
To be fair to those who aspire to measure the former, it seems reasonable that meeting some ideals of best practice probably brings with it a higher probability of success on the ground.
The trouble is, it turns out to be very hard to measure best practice in a manner amenable to creating cross country comparisons. I support the endeavour. But I think it will always be imperfect at best. Then again, alternatives like OECD peer reviews are also imperfect. The world of aid is imperfect I guess.
Ultimately, better evaluations so we learn what works on the ground is likely to be much more practically useful.
But I can still see the appeal of international comparisons, trends over time, etc.
Thanks again
Terence
Very good points Terence. There is one other thing to consider. Too many times institutional donors and some researchers (here’s looking at you CDG…) make the erroneous inference that good aid quality by an agency must mean good quality projects on the ground. This error is not a moot given that aid and project quality have very difference frames of references. Furthermore, as no two projects are the same, it is impossible to infer project quality from a single assessment of ‘aid quality’ (this is related to the ‘ecological fallacy’ in inferring results between different levels of aggregation).
Professionally, what is more interesting is the quality of each project – rather than organizations trumpeting how ‘good’ they are at delivering aid.
I could go on but the PhD on project quality will be submitted soon…