As in many countries, in Tonga gender equity can be a complicated and even contradictory issue. The latest (2019) Multiple Indicator Cluster Survey reports the child marriage rate to be 10% for girls, compared to 3% for boys. It also finds that women are far more likely to be victimised or report discrimination and harassment. At the same time, boys are 14% more likely to be engaged in child labour, 11% less likely to be in early childhood development programs, and 5% more likely to be subject to violent discipline.
These differences are underpinned by complex gender norms. For example, around 40% of women but 20% of men aged 15-49 justified husbands beating their wives for specific reasons (for example, burning food or refusing sex). Such norms tend to be deeply rooted, and evidence on how to shift them is thin (especially in Pacific countries), although they appear to be slowly shifting in Tonga.
This blog shares new data on gender-related views from the Tongan household survey component of the Pacific Labour Mobility Survey or PLMS – a collaboration between the Development Policy Centre and the World Bank, introduced in this earlier blog – then offers suggestive evidence that migration may be one important driver of shifting gender norms.
We asked households whether they agreed or disagreed with the following statements:
- A father’s major responsibility is to provide financially for his children.
- Some types of work are just not appropriate for women.
- Mothers should work only if necessary.
- A husband is expected to work outside the home, while wife is expected to take on domestic duties.
- For many jobs, it is better to choose men instead of women.
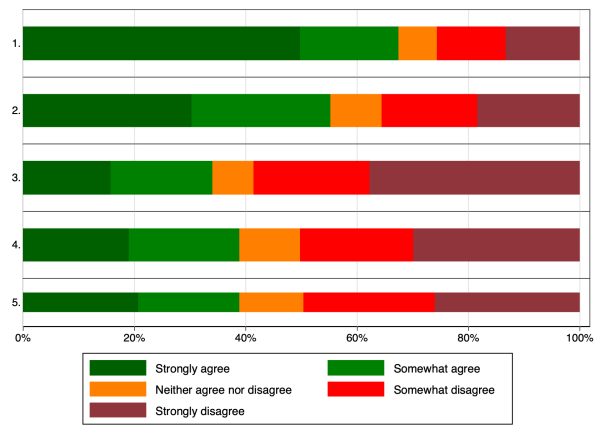
Figure 1 shows the responses. Clearly, traditional gender views remain widely held. For example, almost 70% of respondents agreed that a father’s major responsibility is to provide financially for his children. These questions were asked of household heads, but the patterns are similar if we split the sample up by respondent gender (see these supplementary figures).
Figure 1: Views on gender norms, all households
Migration could affect gender norms in sending countries through exposure to different cultures and practices, or more directly through female employment. Yet female participation in Pacific labour mobility remains low, especially for the Pacific Labour Scheme (20%, early last year).
We can use the questions above to shine some light on the links between migration and gender norms by comparing responses of migrant households (that is, those with a family member working abroad in the schemes) to those of non-migrant households. The main empirical challenge is that people may migrate because they already subscribe to different gender norms, or some other characteristic associated with migration and gender views. Naively comparing migrants and non-migrants tends to give a misleading picture, as I’ve explained in an earlier blog. Without incorporating any randomisation or quasi-experimental evaluation strategy at the policy design stage, it is difficult to do serious impact evaluation. This is an area where Australia and its aid program have fallen far behind peers (see, for example, USAID’s recent appointment).
Nonetheless, there are options to improve on such a naive comparison. The impact evaluation of New Zealand’s Recognised Seasonal Employer scheme matched migrants with non-migrants based on factors that determine eligibility and participation, and compared their changes in outcomes over time. We can do similar with the PLMS (without the changes, at least until we collect the second round of data), matching migrant and non-migrant households based on size and structure, wealth, location, education, English literacy, work history, and migration history and networks. This particular context is one of the few where a matching strategy may be appropriate and allow a causal interpretation.
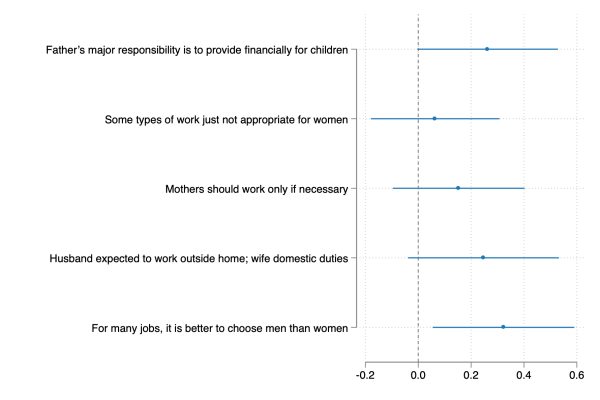
Figure 2 presents the estimated effects for all migrant households – from all three schemes, namely the Pacific Labour Scheme, the Seasonal Worker Program, and the Recognised Seasonal Employer scheme – with horizontal lines indicating 95% confidence intervals. The outcome variable is the five-point scale above, where moving upwards along that scale (that is, a positive coefficient) indicates a shift towards less traditional, patriarchal, and gender unequal views.
Figure 2: Effects on gender norms, all migrant households
All point estimates (dots) are positive, and impacts on views towards the first and the last statement are statistically different from zero at the 10% and 5% levels. For example, in the case of the fifth question, migrant households, on average, shift their responses towards more gender equal views by 0.33 points on that five-point scale – more than a 10% increase.
While these estimates use the 1-5 score as the outcome, we can instead use a simple binary indicator of whether people agree/support or disagree/do not support (as we do when looking at support or opposition to foreign aid). Results are, if anything, a little stronger when using these transformations (see these supplementary figures).
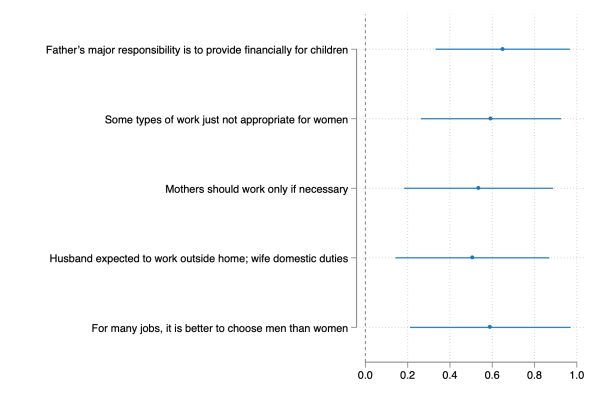
Figure 3 looks at effects for just female migrant households. All estimates shift to the right, converge around 0.6, and are statistically significant. Doing the same exercise by scheme, we see slightly stronger effects for the SWP than from all schemes in Figure 2. With similar female representation across schemes in our survey data, scheme differences are unlikely to be driving these gender-specific effects. This leads me to cautiously conclude that there is a weak effect of general participation in the schemes, on average, and that this principally comes through female participation, for which we see large effects when evaluated separately.
Figure 3: Effects on gender norms, female migrant households
As with any non-randomised study, it is impossible to rule out pre-existing differences being part of the story, even though the rich set of factors we can account for makes it unlikely. It will be interesting, when the PLMS data for the other countries comes in the next few months, to see if these patterns hold up with the larger sample, in other countries and, importantly, for other related downstream outcomes. In the meantime, I’ll be trying to understand the underlying channels a little more before writing this up as a paper.


It would be helpful to know who in households were surveyed given issues around adequacy and accuracy of household surveys generally and specific issues with proxy respondents. Multiple members? Or one person, providing responses about themselves and others?
Thanks for reading, Joanne.
One respondent, notionally the household head or de-facto head if the head is away, and a roster format, for certain issues like school enrolment and work, where they also provide details about individual members so there is individual and household level data. The opinion question here was of the household format so the one respondent. There will be much more detail on this in our forthcoming papers and report, and the data documentation when we make it all public which part of the main goal of this project.
Where women away working abroad, typically the male partner/husband, and vice versa, and we take it to mean their views themselves. On the split by gender above, this is important as male and female respondents to have different baselines (lower and higher respectively). This gives me a little more confidence in the results as these differences push against the direction of the effects we see.
Re: proxy respondents, definitely an issue for some outcomes (e.g., worker earnings, remittances from the households may be subject to measurement error and misreporting, where the worker survey we are doing now will be helpful to compare against this) and I would not interpret opinion data as being the view of anyone but the respondent. The issue of having a partner in the room and the gender or identity of the enumerator may matter here too of course, especially for the non-migrant households where both of them may be present.
I think I’d have to disagree re: “adequacy and accuracy of household surveys generally”. This depends on the survey in question and the specific issue you’re trying to look at, but in general I’m reminded of the popular saying that its the “worst apart from all the others tried”. We very much hope that the PLMS will be a helpful and high quality resource on that front!
Best wishes,
Ryan