

With one of the smallest populations in the world (12,581 in 2019), Nauru is perhaps best known for its riches to rags history, which Helen Hughes shed light on in a 2004 article.
Things looked bleak then, but Nauru has since reverted from rags to riches. In constant prices, GDP has grown at an average of 6.7% between 2004 and 2019. As the figure below shows, the country’s income per capita has increased almost fivefold since 2007. Last year, it crossed the high-income threshold (US$12,535) and Nauru was readmitted by the World Bank to the high-income country club. This may have come as a surprise to some, but then Nauru is a surprising country. This blog recaps Nauru’s riches to rags to riches story.
Figure 1: Nauru’s GNI per capita (current US$)

Riches to rags
Phosphate mining was Nauru’s main source of income in the 1970s and 80s. With high phosphate prices in the 1970s, Hughes estimated that Nauru’s per capita GDP in 1975 was $50,000, second only to Saudi Arabia. However, phosphate exports declined thereafter, as Figure 2 shows. After adjusting for inflation, average annual phosphate exports in the 1990s were little more than one-fifth of their level in the 1970s.
Figure 2: Phosphate exports between 1968 and 2001 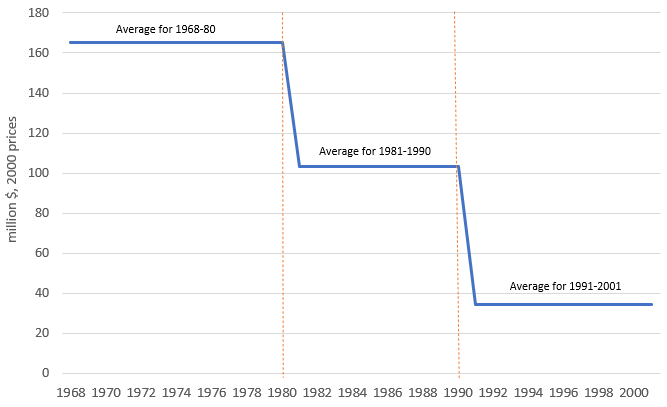
When Nauru gained independence from its trustees (Australia, New Zealand, the UK and the UN) in 1968, its total assets were, according to Hughes, worth about $500,000 per person. However, expenditure during the boom years was not put to good use – it was primarily channelled towards consumption and to support high public wages instead of investment. When investments were made, they were often unsound.
As its phosphate income dwindled in the 1990s, government expenditure began to exceed revenue. In the late 1990s, Nauru grew desperate and as a result faced criticism for being an offshore tax haven and for selling passports – strategies it eventually dropped. The value of the Nauru Phosphate Royalties Trust (NPRT), plunged from $1.3 billion in 1990 to $0.3 billion in 2004, and by then the government was deep in debt, and struggling to pay its bills.
Rags to riches
Against this gloomy tale of decline, how did Nauru re-emerge as a high-income country?
The Nauru economy is dominated by the government. (Government spending actually exceeds GDP.) Government revenue has boomed over the last decade, increasing almost tenfold (and that’s after adjusting for inflation): from $30 million in 2011/12 to $269 million in 2019/20 (in 2019 prices). Expenditure has followed revenue up. Government spending grew from $128 million in 2013/14 to $242 million in 2019/20.
Figure 3: Nauru government own revenue, aid and expenditure

As Figure 3 shows, aid is not that important to Nauru. The most notable new source of income has been the Regional Processing Centre (RPC), launched in 2001, closed in 2008 and reopened in 2012. As controversial as it has been, the Nauru RPC has been transformational for the country’s economy. The Nauru government estimates that the combined direct and indirect revenue from the RPC was a stunning 58% of its total government revenue in 2019/20.
One surprise has been how Nauru has continued to make money out of the RPC even as the number of asylum seekers has fallen: from a peak of 1,233 in 2014 to 211 as of early-2020 (see this Wiki article). The RPC, while now mainly empty, is being maintained for possible future use. The RPC contract remains extremely lucrative (valued in 2019 at $29 million per month), and the Nauruan government extracted about $150 million from it last year in various fees and taxes.
The RPC is not just a major source of revenue, but a large employer. In 2019/20, the Nauru government employed 51% of the Nauruan workforce, and the RPC another 15%.
The other driver of revenue growth has been a boom in the value of fishing in Nauru’s waters. Fishing licensing revenue has grown from $25 million in 2013/14 to $73 million in 2019/20 (again adjusted for inflation). The Nauru Agreement of 2010 was an undertaking by eight Pacific nations with some quarter of the world’s tuna supply to impose a common licensing scheme on foreign fishing vessels. This agreement, combined with a period of high tuna prices, has since resulted in massive increases in licence fees for the eight signatories.
Nauru’s improved economic standing has very little to do with the sort of economic reforms that, back in 2004, Hughes advocated as being essential for it to avert disaster. That said, the country does seem to have learnt some of the lessons of its earlier mismanagement. It has paid off most of its debt. And in 2016, it established a new intergenerational trust fund to build its savings for the coming years. To avoid mismanagement, the trust fund is co-managed by Nauru and two other countries that have donated funds into it – Taiwan and Australia.
Nauru is still very vulnerable, however. Today, the country faces two main economic risks: one, a fall in tuna prices; the other, a decision by Australia to stop funding its little-used RPC. Although Nauru does now have a trust fund to provide a risk buffer, you can see from Figure 3 that it has spent most of its boom-time revenue. The savings accumulated in Nauru’s trust fund so far will only fund about one-third of one year’s budget.
Nauru needs to save more, and in the meantime hope that fish prices stay high and that Australia keeps paying for its largely empty Regional Processing Centre. Otherwise, Nauru’s second stint as a high-income country may be, like the first, only temporary.
Data notes
[1] For the purposes of income-grouping classifications, GNI per capita is calculated by the World Bank using the Atlas method. This involves the use of a conversion factor that takes into account the exchange rates for the current and two preceding years, adjusted for differences in inflation rates between the country in question and the Euro area, the US, the UK and Japan. In Figure 1 (source: World Bank), before 2012, GNI per capita is calculated using the current exchange rate.
[2] Source for Figure 2 is Helen Hughes’ 1994 article (Table 1). For Figure 3, FY11/12 and FY12/13 fiscal figures were taken from the ADB’s “Securing Sustainability – Nauru’s New Intergenerational Trust Fund and Beyond” report. FY13/14 to FY15/16 figures were taken from the financial statements of each year. FY16/17 and FY17/18 figures were taken from the draft financial statement, which has not been audited. FY18/19 and FY19/20 figures were taken from the fourth quarter financial report. All of the Nauruan government documents can be found at this link. Own revenue is defined as total revenue excluding grants. To adjust these figures to 2019 A$ terms, the GDP deflator series for Nauru provided by the World Bank was used. The GDP deflator is the ratio of a country’s GDP in current local currency to GDP in constant local currency.
[3] RPC-related revenues in 2019/20 were about 58% of total government revenue according to Nauru’s FY19/20 Q4 report (see page 8). 51% of the Nauruan workforce was employed by the government and a further 15% by the RPC (see page 8 of the 2019/20 Budget Paper 2 for more details).
[4] All dollar figures are A$ (the Nauruan currency) unless otherwise stated.


Guyana may be the new Nauru. GDP per capita PPP is projected to surpass UK and Canada this year. Projected to hit as high as US$200,000 in 2030.
It’s an economist’s dream, but what do these figures mean if we don’t look at them together with other indicators? Nauru’s infant mortality rate is 26 (Australia = 3) and its under 5 mortality rate is 31 (Australia = 3). How is revenue spent? Who are the beneficiaries? Who has wealth and who doesn’t, and how big is the gap?