A previous blog introducing the Tongan household survey component of the Pacific Labour Mobility Survey answered three questions on remittances. One of these questions was “What are remittances used for?”. We saw that, when people were asked whether they used remittances for different things, the most common uses were (a) paying everyday expenses, (b) donating to church, and (c) paying school or other educational fees.
Yet this question does not tell us how much people are spending on different categories, and whether participating in temporary migration schemes in fact affects the levels or patterns of household spending back home. Using the detailed information on household expenditures from the same survey, we can approach these questions by comparing this data for migrant households to that for non-migrant households.
The questionnaire asks how much people spend on different goods in a nominal week, the last month, or in the last 12 months, depending on the type of goods. We aggregate these into monthly data, for consistency. There are 25 types of goods, which we also aggregate into total expenditure, basic consumption (that is, food and other daily needs), necessary expenditure (that households pay frequently, such as utilities, mobile data, petrol, and maintenance of their house and vehicle), durable goods (for example, furniture, electric goods and home appliances) and investment, for analysis. Respondents reported expenditure in local currency, pa’anga (see supplementary material for more details).
Table 1 shows the average total spending, per capita spending, and relative budget shares for migrant and non-migrant households across each expenditure category. We use this household-level expenditure data to ask two main questions: does temporary migration affect total household expenditures, and does temporary migration affect the relative budget shares of different goods?

Since naive comparisons between households with temporary migrants and those without can be misleading (as described in this recent blog), we use a matching strategy to bring our comparisons a little closer to the experimental ideal. The selection process for these schemes actually lines up well with key assumptions for such a “selection on observables” research design.
First, we know that workers are eligible, then selected, based on a number of key characteristics which we see and can thus adjust for in our data, such as health and age. For more difficult-to-observe factors – which are the key concern with this type of approach – we have rich information on location, household assets, past employment, migration history and much more, from which we expect to at least partially capture such factors, like intrinsic motivations and social networks.
Another key assumption is “overlap”, that we actually have sufficiently similar households in our non-migrant and migrant samples. Since not all applicants can participate in the schemes, there are ample households with similar characteristics that were suitable for the schemes that did not get selected or even apply. We estimate a propensity score – which allows us to find migrant and non-migrant households with very similar odds of participating – conditional on household size and structure, wealth, island of residence, education, English literacy, employment history and migration history, and use that to estimate the “treatment effects” of temporary migration on household expenditure patterns.
Figure 1 presents the estimated impacts of temporary migration for all households, on all categories separately, with horizontal lines indicating 95% confidence intervals. We take the natural logarithm of all expenditure variables, so a rough interpretation here is the percentage change relative to what would have happened in the absence of temporary migration. Migration increases expenditures on food consumption at home (19%), housing (45%), non-durable goods (29%), gambling (5%), education (20%) and lending money (16%). Vehicle spending is reduced (5%), and the coefficients for investment are not statistically different from zero at the 10% level.
Figure 1: The impact of temporary migration on different expenditures
If we look at more aggregated variables (Figure 2), we see that only the coefficient for basic consumption is positive and statistically significant at conventional levels.
Figure 2: The impact of temporary migration on aggregate expenditures
Among these level impacts, the positive impact on lending money is worth a brief comment. The survey was carried out from November 2021 to January 2022, during COVID-19. This positive impact therefore might reflect more informal money lending across families, relatives and friends due to remittances sent by temporary migrants while the Tongan economy was being battered by the pandemic.
Figure 3 shows the impacts on budget shares – the changes in the share of expenditure out of total expenditure, to examine potential reallocation of the household income – at an aggregate level. The patterns are like Figure 2: a positive effect on basic consumption, and no evidence of any effect on investment.
Figure 3: The impact of temporary migration on aggregate budget shares
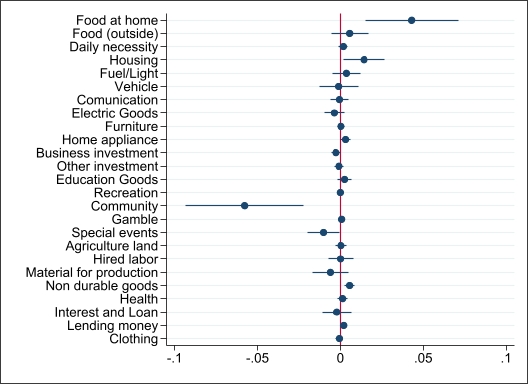
Figure 4 disaggregates these relative effects to find that temporary migration increases the budget shares of food at home (4%) and housing (1%), but decreases the share of community spending (6%). The last result looks surprising because more than a third of recipients reported donating some remittances to the church (Table 3 in this blog). However, the absence of key household members (as migrants) obviously could explain this drop, for example through deferred, in-kind, or direct transfers.
Figure 4: The impact of temporary migration on different budget shares
Since the Seasonal Worker Programme (SWP) generates higher levels of remittances than the other schemes, we also investigated differences in expenditure impacts across programs. The Pacific Labour Scheme (PLS) is omitted due to the relatively small number of PLS respondents. Overall, both the SWP and the Recognised Seasonal Employer (RSE) scheme appear to support basic consumption but not investment, although the patterns across the two schemes are slightly different. In the aggregate categories, the SWP increases durable goods expenditure. In the subcategories, it increases expenditure on food at home (34%), while the RSE increases expenditures on daily necessities (39%), housing (32%), health (49%), home appliances (30%), gambling (11%) and non-durable goods (27%). For the budget shares, SWP increases the budget share on food outside the home (2%), and both programs decrease spending on the community (5% for SWP and 7% for RSE).
Our preliminary findings, like the previous blog, suggest that Tongan households use income from temporary migration programs mainly to meet basic consumption and necessary spending, rather than as a source of productive investment. Although the findings remain preliminary (this analysis is part of Hiroshi’s master’s dissertation currently in progress), and estimates not without limitations, the findings suggest that we should think about how these schemes can be a more accessible, flexible and effective financial management tool in the near term (see also this episode of Devpolicy Talks), rather than, for example, an instrument for economic growth and broader economic transformation, for which such evidence for now remains thin. They also suggest that – if focusing labour mobility earnings on consumption is in fact not optimal – it may be worth investigating why households do not seem to make more productive investments, and ways to overcome this.


Hi Bal,
Thanks for the comment. Don’t quite understand your first sentence. Per the title, this is just evidence from Tonga and for sending households, and I think the design and what we can infer from these comparisons is pretty clear above.
This paper here, which is Hiroshi’s masters’ thesis work in progress actually, doesn’t use a worker survey, but I reported in an earlier blog an initial look at some household reporting of these figures, how much is sent, and so forth. There, you’ll see the average worker appears to be sending back more than they would have earned before moving. Whether they have enough to “go beyond” very much depends on the characteristics of the household being supported and much more. In many cases though, it appears to be a matter of tastes and preferences (e.g., buying different and better things), as you’d probably expect, rather than a ladder of needs and wants.
In terms of net fortnightly incomes before and after tax and deductions, we have a separate worker survey as part of the PLMS for workers from three countries in both Australia and New Zealand which has all this information, and we are in the process of contrasting the household and worker reports at the moment. These findings will all be detailed in a forthcoming report joint between the centre and the World Bank, in a few months, and of course some more detailed papers for journals. I have a separate project where we are looking at this at a higher frequency in Fiji, weekly, so a pretty rich picture for workers from four countries now.
Cheers,
Ryan
Hi Ryan and Hiroshi, curious your research focuses on how seasonal workers supports “everyday expenses”, a line of conclusions can generally be applied to many other countries in the Pacific. However, have you find out what they, the seasonal workers, net incomes fortnightly are? Are you able to obtain payslips and ascertain average net income amount your research participants?
The conclusion about not venturing into investments can be also be explained by the above inquiries. They might not make enough to go beyond funding “everyday needs”. So I think the conclusion is incomplete without these data.