
Given it’s budget time, those that work on international development issues are once again focused on that strange statistic, the ODA/GNI ratio, and the various targets, averages and historical trajectories related to it. It has become the standard for comparison of aid spending between countries, given it is adopted across the OECD, and reported on by the DAC. In essence it is seen as a benchmark for a country’s generosity and engagement with the developing world. But there are some obviously flaws with its use, for example it does not reflect on the quality of aid, and the delivery mechanisms used (ie donor countries’ domestic firms versus programmed aid through developing country budgets). Does it also truly reflect a Government’s commitment to aid?
The ODA/GNI ratio compares a Government ODA expenditure allocation against a much broader statistic on a country’s total income, including a range of factors related to personal and business income, which are beyond the direct control of government. Wouldn’t a more accurate numerator for GNI to reflect a country’s generosity be the total amount ‘gifted’ by a country (companies, individuals as well as Government)? This would reflect other flows to the developing world, including donations, philanthropic and CSR activities and even some forms of investment. The obvious problem with this is the difficulty in estimating the relevant data.
So what about a more appropriate denominator for Government ODA expenditure? Wouldn’t a truer reflection of a Government’s stance and commitment to aid be the percentage of its budget – something entirely within its control – that is allocated to ODA. In theory a Government could oversee a period where the ODA/GNI improves, but the Government actually shows less commitment to ODA and allocates a smaller percentage of expenditure to it – for example during a period when GNI is contracting and therefore Government expenditures represent a larger percentage of the GNI.
Another advantage of reflecting ODA expenditure against total Government payments is it is more easily communicated to the general public. How much of your individual taxes would you be prepared to see utilised to assist those less well-off in the poorer nations of the world? If you paid $10,000 in taxes do you think the Government should allocated $50, $500 or more of that to the developing world? How much do you think the Government currently allocates to ODA out of your $10,000 in taxes?
Below is a graph showing Government allocations to ODA for every $100 it budgets to spend. The graph disaggregates expenditure budget allocations to ODA under Coalition and Labor Governments, and demonstrates a change of government can result in a dramatic impact on the amount allocated to ODA from the in-coming government. It also depicts the ODA/GNI ratio. I have scaled this to include 0.7 % ODA/GNI which I think still is the official OECD target, with Australia’s recent commitment being to reach 0.5% by 2016/17.
ODA budget allocation for every $100 of federal government expenditure
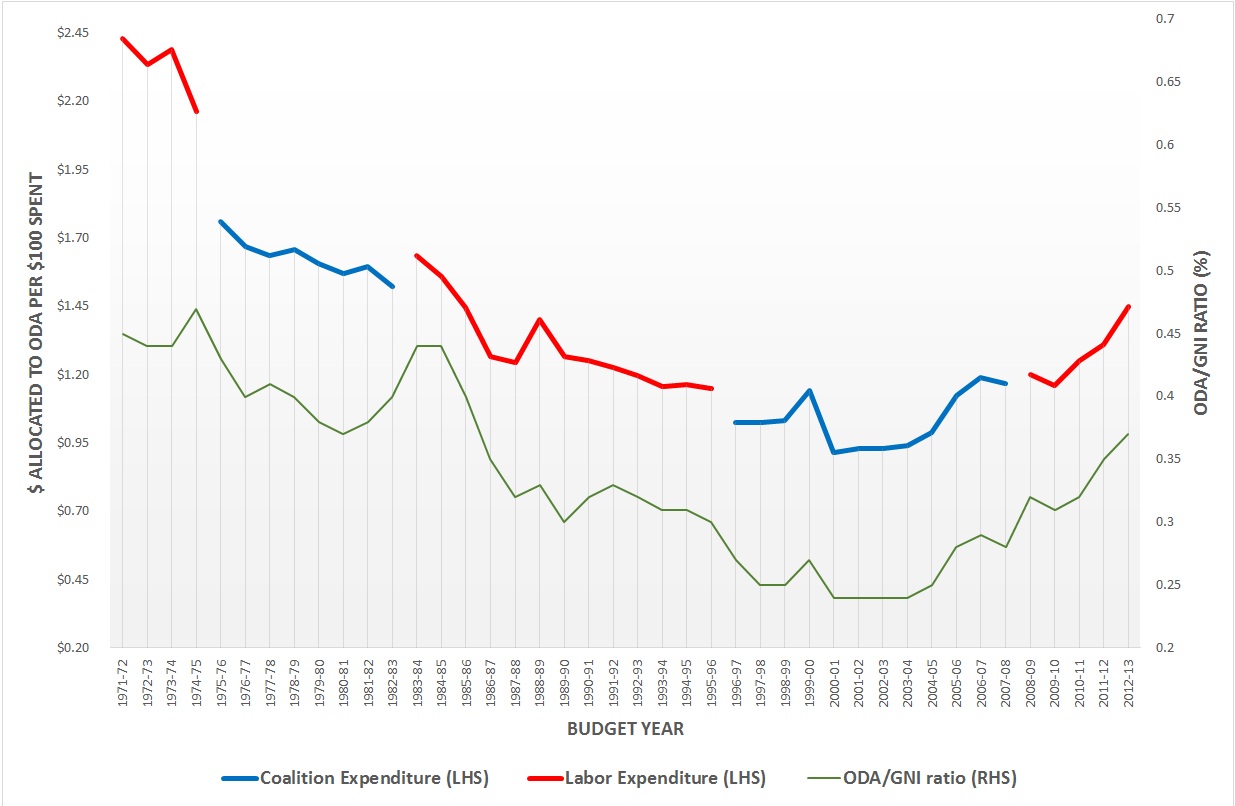 The government expenditure ratio appears to closely align with the ODA/GNI line below, and the overall picture of a Government’s commitment towards ODA is not dramatically different.
Of interest though is the period during times of economic downturn when this correlation does not hold. The budgets 1989/90 and 1995/96 both resulted in an ODA/GNI ratio of 0.30%, but the percentage of total expenditure actually fell from $1.27 to $1.15 per $100 of budgeted expenditure for the respective years. Similarly in its last budget in 2007/08, the Coalition allocated $1.17 to ODA per $100 of expenditure, compared to Labor’s second budget in 2009/10 which allocated a slightly less amount of $1.16. Yet ODA/GNI jumped from 0.28% to 0.31% for these years.
So in answer to the question above, in the 2012/13 budget it was estimated that $1.42 out of every $100 it spends would be on ODA related activities. Therefore out of your $10,000 in taxes, the Government has decided to invest $142 into ODA (the 2013/14 budget has taken this up to $1.45 out of every $100 the government spends, or $145 in the case of this example). More or less than you thought? It will be interesting to see what the actual outcome for 2012/13 is against this original estimate, but one would expect it be less given budget re-allocations during the year.
While the ODA/GNI is beyond its control, the priorities of budget deliberations during an election year will be clearly reflected in the ODA allocation to total expenditure ratio.
It would also be of interest to undertake an international comparison over time of this government expenditure ratio to see if this makes any difference to Australia’s international standing in terms of ODA commitments amongst DAC members. One would suppose countries where Government expenditure represents a greater proportion of GNI (e.g. Scandanavian countries) are represented better by ODA/GNI, whereas others may appear more generous under this alternate measure.
And in the lead up to the election, perhaps a more constructive conversation starter with the Australian public is to ask the question what percentage of their taxes would they be happy to see going to those less fortunate than ourselves in developing countries?
Angus Barnes is an independent consultant with 20 years’ experience in Australian aid and international development.


Hello Angus,
Thank you for your interesting blog. I was just hoping to hear what your (and others) thoughts were about including the following in the ODA generousity measure:
1) Government Debt as a percentage of GDP – higher government debt would imply greater generousity
2) GDP per capita – lower GDP per person would imply greater generousity
There is a great deal of variation among OECD countries across these indicators.
If they were factored in, how would Australia compare in terms of generousity?
Hi Chris,
Thanks for your comment.
I’m not sure I understand your first measure. Aid is a very small % of government spending and so, effectively contributing factor to any debt which a country might possess, so I don’t quite see how debt could be used as a measure of aid generosity.
On GDP per capita — after a very quick preliminary think about it I think I get your point.
For example (using GNI/Capita which is very close to GDP/Capita) for simplicity’s sake. If we imagine two countries (A and B) with the same GNI but one (A) which has twice as many people as the other (B). B is in fact a much poorer country than A, but if they gave the same amount of aid their aid/GNI ratio would be the same. Which seems unfair as B is sacrificing more than A. On one hand this isn’t perhaps a huge issue as the OECD DAC is made up of countries that are all pretty wealthy on a GNI/Capita measure. However there is some variation between the most and least wealthy, and what you are suggesting would be a measure of generosity that better takes this into account (I think). Note that as Australia is one of the wealthier OECD countries (by GNI/Capita) on your suggested measure it would come out looking somewhat worse than it does on a pure per GNI measure.
Thanks again
Terence
Hello Terence,
Thank you for your response.
In terms of how aid donor generousity relates to debt as a percentage of GDP, I was refering to the pressure on the donor government’s budget. For example, say two countries (A and B) that give the same share of ODA/GNI, Country A has debt as a percentage of GDP of 100% and Country B has debt as a percentage of GDP of 20%, Country A could be considered more generous.
Do you think that is reasonable?
How would this change OECD aid donors ranking?
Hi Chris,
It’s an interesting suggestion but I don’t think it’s a fair assessment of generosity for two reasons:
1. The amount of debt a country has is, in most circumstances, a political decision (they could have less if they raised taxes) and it seems unfair to ‘punish’ a country and make them seem less generous simply because they have a long run sustainable fiscal policy.
2. Aid as a percentage of total government spending is, as this post shows, low (approx 1%) so it plays no real role in whether a country has a deficit or not.
Good, interesting suggestion though.
Although, on the other hand country B because it is more populous is asking each individual citizen to give less, which mitigates the above in a sense.
Thanks Garth. That is very interesting information (and also true of other countries if my memory serves me well). For the record, I definitely agree with you and Angus on the merits of ODA over total govt spend as a means of communicating aid share with the public.
Hi Angus,
Thank you for an interesting comment. When giving talks on New Zealand aid I have in the past used ODA/government spending figures myself (or ODA/government revenue).
I agree this is much more meaningful to the public, allowing you to say something (at least for revenue) along the lines of “Out of every hundred dollars you pay in taxes one dollar goes to aid”, or something similar.
However, the measure has two limitations.
1. For international comparisons, countries making the same aid effort, may end up with different results simply because of the government structure they have. For example, the figure in your chart is, I presume aid spend/*federal* Australian government spend. But in New Zealand where we don’t have a state government system the only number we can really use is aid spend/total government spend, which leads to a lower ratio (that and the fact that we give less aid). This isn’t an insurmountable problem, but would need to be carefully considered in cross country analysis.
2. Countries can always fund aid increases through raising taxes. Indeed, rather than take the money from social services as home, this is how I would prefer my government did do this. However, your measure gives countries no credit to countries that fund more aid by having higher taxes and higher total govt spending.
The US would appear considerably better on your measure vis a vis Sweden than it does on the old ODA/GNI ratio. Which is unfair, I think — the Swedes sacrifice more of their wealth for ODA than the Americans and should be given credit for this sacrifice. That they have a more sensible social model too hardly seems something we should punish them for in international comparisons.
Ultimately I would say that once you take into account the possibility of differing levels of taxes between states ODA/GNI remains the most meaningful metric for international comparisons.
Thanks again for an interesting post.
Terence
Thanks Angus for starting this interesting discussion.
While I agree with Terence’s arguments about the better comparability of the ODA/GNI ratio I do think that the ODA/federal budget ratio can have more meaning for the public, and in some ways, for MPs. For this reason World Vision and other groups have often included questions in opinion polls about what share of the federal budget the respondent thinks is currently spent on aid and what share they think should be spent on aid.
Every survey I have read has the following outcome:
– most people think that a greater share of the budget is spent on aid than actually is, and
– most people suggest a share that is higher than the current 1.4% of budget expenditure.
I think the 2011 Lowy Poll was the most recent Australian opinion survey to cover this. It found that the average estimate of current ODA/gov expenditure was 16%, while the average suggested share was 12%.
Australian NGOs campaigning for greater aid regularly highlight the very small share of the budget that goes to aid, but we tend to focus on the ODA/GNI target as we do not want to confuse people with different measures.