
According to PNG’s 2024 census, 23% of the population live in the Southern region, 27% in the northern Momase region, 15% in the PNG Islands and 36% in the interior Highlands. When we did our annual survey of students at the University of Papua New Guinea (UPNG) last year, we were surprised to find a very different distribution of students across regions. We asked the almost 400 students we surveyed what their province of origin was. Students could pick more than one. Most gave only one, but some gave two and a few more than two. On average a student selected 1.3 provinces.
We then classified a student as being from one of the four regions depending on whether they listed at least one province from that region. It turns out that 63% of students trace their heritage at least in part to the Highlands. Since some students are connected with more than one region, the shares add up to more than one (1.17 to be precise), but the differences are clear from the relative shares: the Highlands share is more than twice the next highest share.
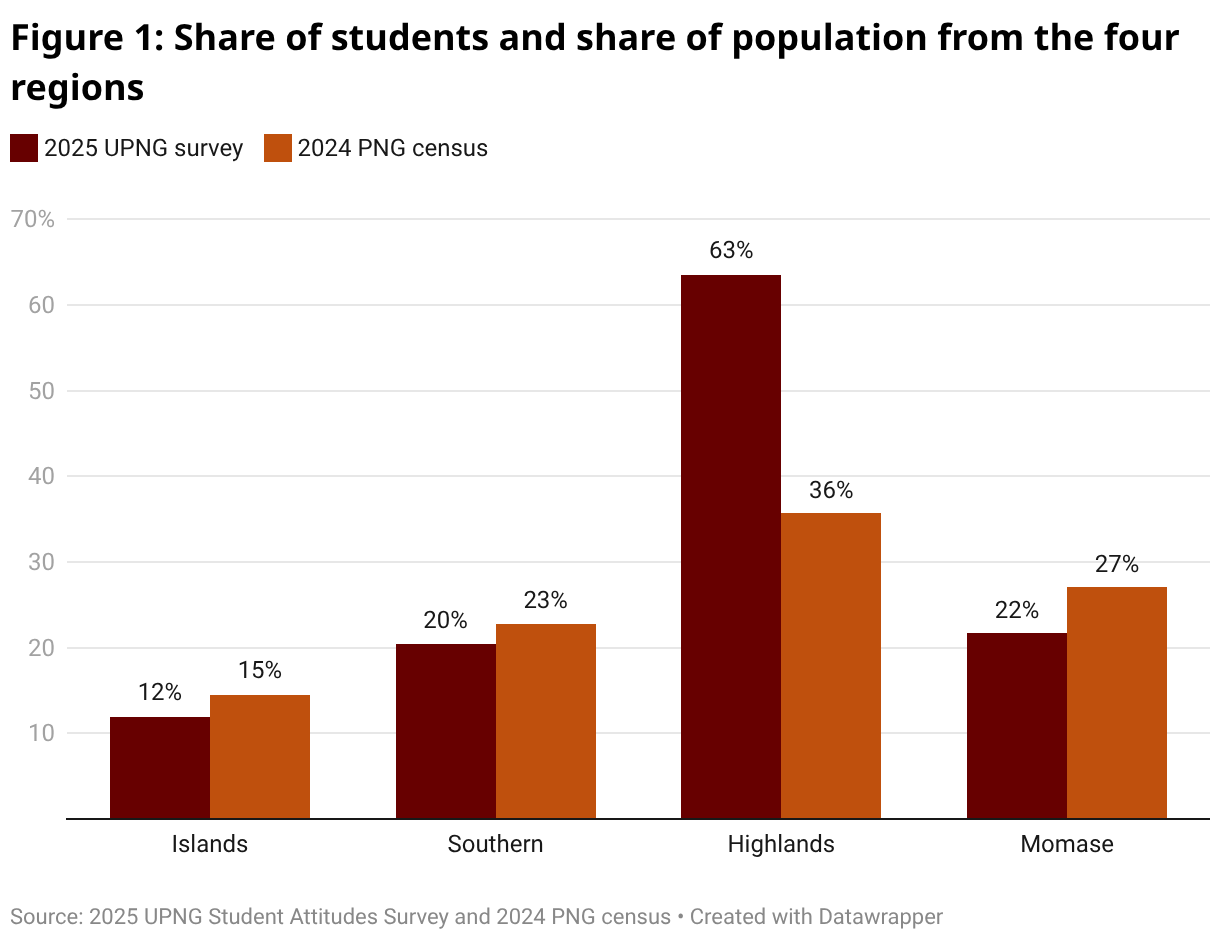
What is going on here? We only surveyed School of Business and Public Policy students and perhaps more Highlands students are attracted to economics, accounting and so on. It is also worth pointing out that the 2024 student survey did not have as much of a skew to the Highlands. Some of the variation might be random. That said, the Highlands 2024 share was still 55%, which, while below 2025’s 63%, was still way in front of the next highest share which in 2024 was the Islands with 29%.
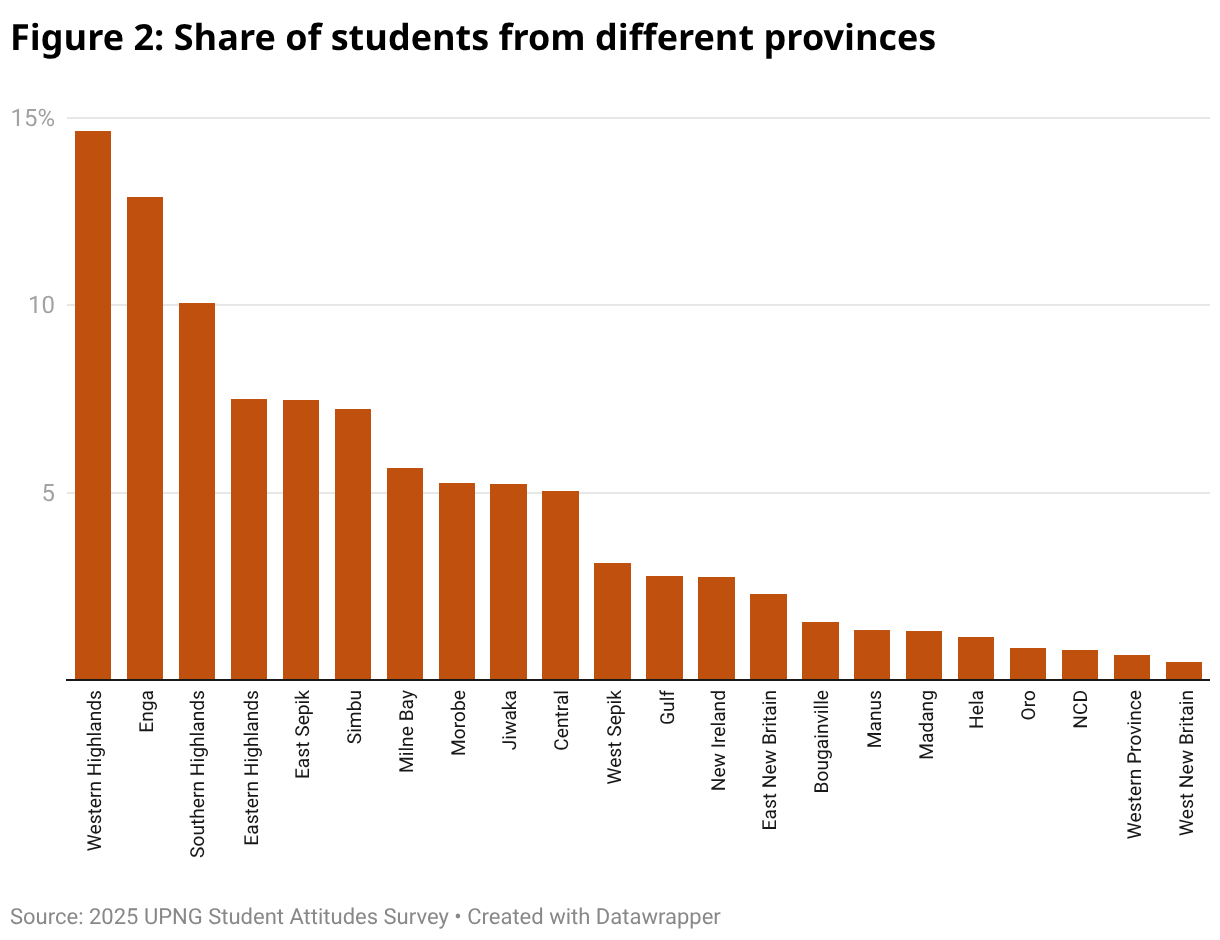
This regional domination by the Highlands also extends to the provincial level. The top four provinces in terms of student representation are all from the Highlands: the Western Highlands (15%), Enga (13%), Southern Highlands (10%) and Eastern Highlands (8%). (Note these provincial figures are normalised to add to 100%. A student who lists more than one province is allocated to all of them with a weighting that is the inverse of the number of provinces listed.)
Why are Highlands students over-represented? Some Highlands provincial governments have been active in providing scholarships. That could be one reason. Being economists, we leave cultural explanations for others to speculate about, but we do note that at independence Highlanders were afraid of being left behind (and so opposed independence). That certainly doesn’t seem to be the case anymore.
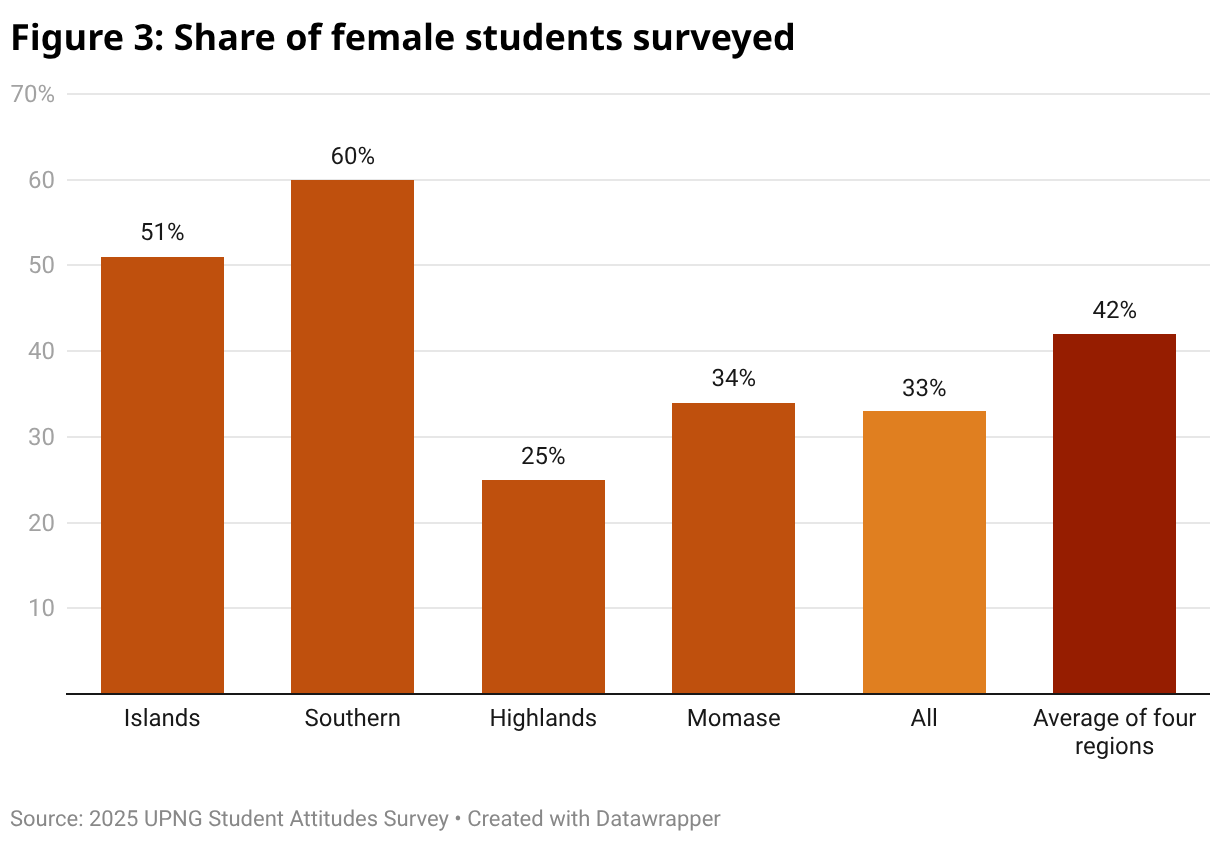
Whatever the reason, this regional distribution has an interesting impact on the distribution of students by gender. There is a pronounced bias in the composition of our survey group to male students, who make up two-thirds of the almost 400 students we surveyed. But if we break this down by region, we see a very different picture. There is one region, the Islands, where there is basically gender parity (51% of students are female) and one region, Southern, where there is actually a clear majority of female students: 60% of Southern students are female. The bias towards male students is evident in the Momase cohort, where 65% of students are male, and is particularly pronounced in the Highlands where 75% of students are male.
The differences in gender composition across the four regions are both large and statistically significant. If the four regions had equal weighting, 42% of the students would be female rather than the actual 33%.
The fact that gender bias varies so much across the four regions, and is only found among students from the Momase and Highlands regions is suggestive of very different attitudes to gender from different parts of PNG. Females are 60% of the total number of domestic university students in Australia. What makes PNG’s Southern region look like Australia in this regard? A fascinating topic for future research.
This is the last in a series based on the 2025 UPNG student attitudes survey. Results were also summarised in the authors’ 2025 PNG Update presentation. The results of the first survey, conducted in 2024, are reported here. Statistical significance is judged using the Chi-square test.


This is a lovely fresh piece of information even if only being indicative. This fondly reminds me of UPNG’s student records section publishing in A2 size coffee table booklets showing student enrollments by province, gender, religion and even ethnicity. (I still have a copy to myself.) On this basis, this snapshot study might be helped with some quick comparisons between the decades or universities and colleges from elsewhere in the country. Also, high figures for the highlands region is likely a reflection of the population density and size, and is of no surprise really.