
The Pacific islands is one of the most aid-dependent regions in the world. In a recent paper published by Asia and the Pacific Policy Studies (available in early view, free of charge, here), we use OECD data to examine developments in the delivery of foreign aid to the region since the year 2000. This post focuses on the amount of aid provided to the region, including its allocation, how it has changed over time, and its source.
Since the turn of the century, there has been considerable change in the amount of aid delivered internationally. A renewed focus on poverty, evident in the Millennium Declaration (and ensuing Millennium Development Goals), resulted in commitments to increase foreign aid to developing countries that were agreed by OECD leaders as part of the 2002 Monterrey Consensus. Official Development Assistance (ODA) provided around the world subsequently rose, from $86 billion in 2000 to $178 billion in 2014 (both measured in constant USD, 2014).
How did foreign aid to the Pacific fare in this period?
ODA to Pacific island countries increased in the last decade by approximately one-third after a long period of relative stability, despite significant year-to-year variations (Figure 1). The increase in ODA coincided with high-level calls to ‘scale up’ aid to developing countries, discussed above, and with two major military interventions in the region.
Figure 1: Aid to the Pacific (including Timor-Leste)
")
Source: OECD data. All figures are in 2014 USD.
Although significant, the increase in ODA to Pacific nations is modest when compared to the increase in ODA to sub-Saharan Africa, or indeed, to developing countries as a whole. Figure 2 illustrates the relative increase in ODA enjoyed by different regions since 1970. While aid to Pacific nations has remained relatively stable in real terms since 1970, increasing moderately in the last decade, it has increased more than six-fold in sub-Saharan Africa over the same period, and almost three-fold in other developing countries. ODA has remained stable, and more recently fallen, in Far East Asia owing to the strong economic growth enjoyed in that region. The divergence between regions is especially notable after 2000, or in the period of the scale-up. Whereas ODA to the Pacific increased by one-third since 2000, across all developing countries it doubled, and in sub-Saharan Africa the increase was higher still, with ODA in 2014 230 percent what it was in 2000.
Figure 2: Official Development Assistance (Index, 1970 = 100)
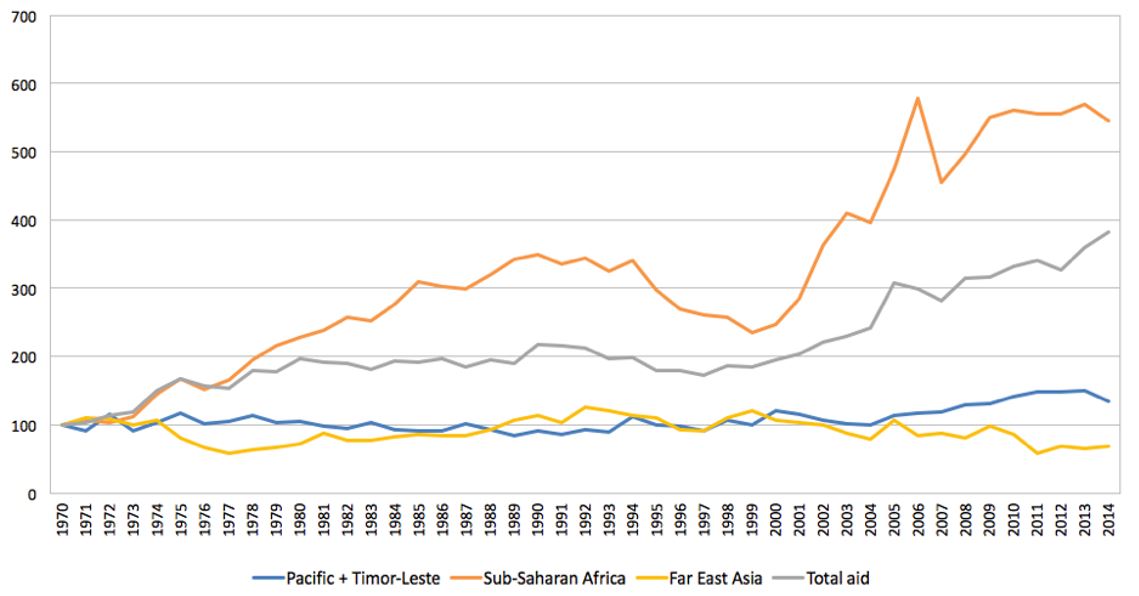
Source: OECD data. All figures are in 2014 USD.
Changes in the allocation of foreign aid across Pacific island countries have not been linked to per capita income, or arguably by association, poverty reduction efforts. Countries with comparatively high per capita incomes such as Cook Islands, Niue, and Tonga have seen large increases in aid over the period of 2000-02 and 2012-14 (119, 93, and 116 percent respectively), whereas aid to the two Pacific island countries where poverty is concentrated, Papua New Guinea and Timor-Leste, grew 19 percent and fell 36 percent, respectively. The largest increase between over this period, interestingly, has been in ODA directed to regional initiatives and organisations. This now represents the third largest component of ODA to the Pacific.
When aid per capita is considered, its unequal distribution between Pacific island countries is even more evident. Aid per capita is particularly low in Papua New Guinea and Timor-Leste (the two poorest countries in our sample), and has decreased in real terms since 2000-02 in both countries. Indeed, Figure 3 shows that aid per capita received by Timor-Leste, Fiji and Papua New Guinea sits close to the (unweighted) average for Far East Asia – far below that of the Pacific.
Figure 3: ODA per capita across Pacific island countries

Source: OECD and World Bank data. All figures are in 2014 USD.
Where does this aid come from?
While much depends on how aid is measured, it is clear that Australia is the largest provider of development assistance in the region – though there is significant variation between Pacific island countries, with those in the North Pacific more reliant on Compact Funding from the United States (see Figure 4). Aid to the Pacific is also very concentrated. In no other region in the world does a single donor provide such a large share of total ODA as Australia (the United States in the Middle East comes close). The situation has not changed in light of the recent cuts to the Australian aid budget, with aid to Pacific island countries largely protected from reductions (although aid from Australia has declined in real terms).
Figure 4: Top 10 Pacific donors

Source: OECD data
Chinese aid is often highlighted as significant in the region (frequently as cause for alarm, though we take a different view). Exaggeration of its importance is compounded by the fact that data for Chinese development assistance is poor, and not included in OECD figures (or in Figure 4). In our paper, we draw on an extensive Lowy Institute survey of Chinese assistance to Pacific island countries, based on information sourced from budget documents and other government sources, to compare China’s aid with that of OECD donors. These estimates are compared to OECD data for other donors in Figure 5 over the 2006-14 period (multi-year data are more reliable given challenges associated with calculating yearly expenditure of Chinese ODA-funded projects).
Figure 5: Top five sources of ODA to Pacific island countries, 2006-14 (current, USD billion)
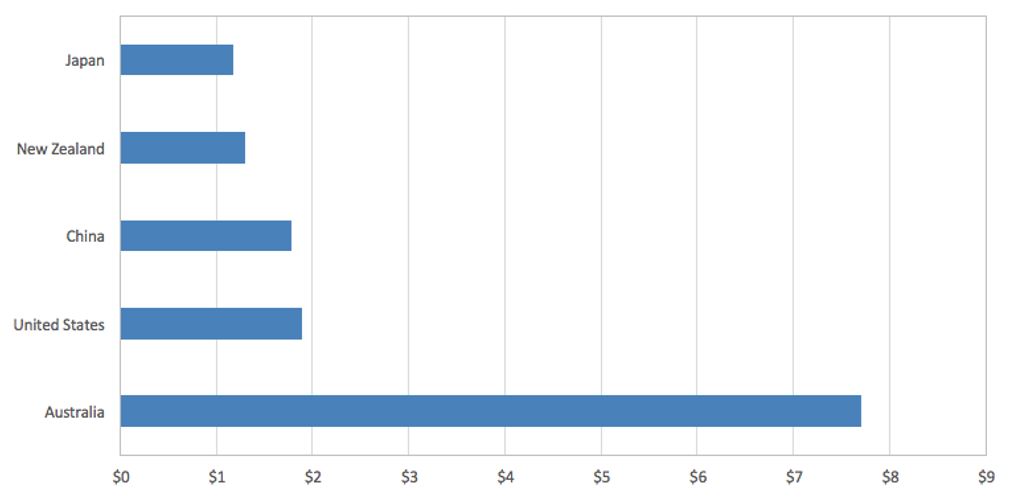
Source: Data provided to authors courtesy of the Lowy Institute.
Note: Chinese aid is likely overstated as it includes both concessional loans that would in turn be discounted in future years as they are repaid, and also includes projects approved in 2015 and early 2016.
What the comparison suggests is that China has become the third most important source of ODA to the region, with a total of US$1.78 billion provided as development assistance between 2006 and 2016. This indicates that, while certainly significant, China remains a long way from becoming the most important donor to the region (despite common statements to this effect).
Having said that, China is an especially important donor in a handful of countries. It has provided over 50 percent of total ODA to Fiji between 2006 and 2013 (making it the largest donor), and close to 30 percent of ODA in Cook Islands, Samoa, Tonga and Vanuatu, where it has become the second main source of development funding. Much of this (approximately 80 percent) takes the form of concessional loans.
So, what can we conclude? Firstly, foreign aid to the region is not going away, nor is it becoming less important. Since the turn of the century, foreign aid as a percentage of gross national income has increased in almost half of all Pacific island economies – significantly so, in the case of Tuvalu, Kiribati and Solomon Islands. It has declined significantly in the case of the resource-rich economies of PNG and Timor-Leste (see our paper for data). Secondly, aid to the region has increased over the period – in line with the international scale-up in foreign aid – but not to the extent it has in other regions, or in developing countries as a whole. A third point to note is that foreign aid is distributed very unequally in the Pacific, with per capita aid to the poorest countries often quite limited. This is troubling from a poverty alleviation perspective. Lastly, our analysis shows that while China has become an important donor, it is far from the dominant player in the region – despite alarmist reporting to that effect.
Matthew Dornan is Deputy Director of the Development Policy Centre. Jonathan Pryke is a Research Fellow in the Myer Foundation Melanesia Program at the Lowy Institute.
The paper upon which this post is based can be accessed free of charge here.


I’m a Papua New Guinea citizen. How can I get donor funding assistance for our Local Community School?
Very interesting. It’s shows that most of the foreign aid from powerful and the rich countries in the world seems like as a “foreign disaster” for the recipient countries. I hope that the rich countries may evaluate their foreign aid system to aligned with the real condition of the recipient country.
I think it’s very important for people to know that the pacific needs help from all of us.
Matt and Jonathan,
Should we be concerned that aid has not increased as quickly as aid to Africa given that average per capita aid to Africans is only one fifth of that to our island neighbours?
And should we be concerned about decreases in aid to PNG, Timor Leste and Fiji given that average per capita aid to these three countries is still twice as large as the average per capita aid to Africa?
http://www.oecd.org/dac/financing-sustainable-development/development-finance-data/TAB25e.xls
Hi Garth
Good questions (as always).
As you know (and are getting at in your comment), there is longstanding debate regarding the extent to which Australia’s aid program should be more focused on sub-Saharan Africa. For my part, I see good reasons for focusing on our region: improved aid effectiveness (lower costs, better knowledge of the region, etc), strategic reasons (which like it or not, make it less likely Australia will abandon its aid program due to other priorities), and more opportunity for Australia to enhance its aid with other policy levers (e.g. migration). That’s not to say Australia has no role to play in Africa, but it will never be a primary focus.
Our analysis was regional: how did PICs benefit from the international scale up? We didn’t compare PICs to sub-Saharan Africa in a bid to say that the former had been unfairly treated. In fact, we specifically say in our paper that the international focus on Africa is understandable given poverty alleviation objectives behind the scale up.
As for your questions: the measures of the Pacific as a whole (which are unweighted country averages) are distorted by countries that receive very high per capita allocations (e.g., Niue and Marshall islands). It’s better to focus on the country figures. In a regional context: yes, I think we should be concerned that despite a scale up for the region, we are seeing decreases in per capita aid to PNG and Timor Leste – the two countries that clearly demonstrate most need. I am concerned about that in the same way I am concerned that aid to sub-Saharan Africa has never reached the levels promised by the international community (as Sachs has long pointed out). I’m not so worried about Fiji, given its better development indicators.