In my first post on this subject, I assessed the reliance of Australian and New Zealand seasonal work schemes on return workers by examining average visits per workers. This is a simple and useful indicator, but also an unreliable one. It tends to increase as schemes age, and fall as schemes expand. Yet neither of these factors mean that a scheme is becoming more or less reliant on return workers. To control for these confounding factors, I create an index of reliance on return workers. I set the index equal to zero if the average of visitors to workers is one, that is, if there is no reliance on return workers. And I set the index equal to one if the average of visitors to workers indicates that new workers are brought in only when the scheme expands, that is, if there is maximum reliance on return workers. I use a linear transformation of the actual average of visits to workers to create this zero-to-one index.
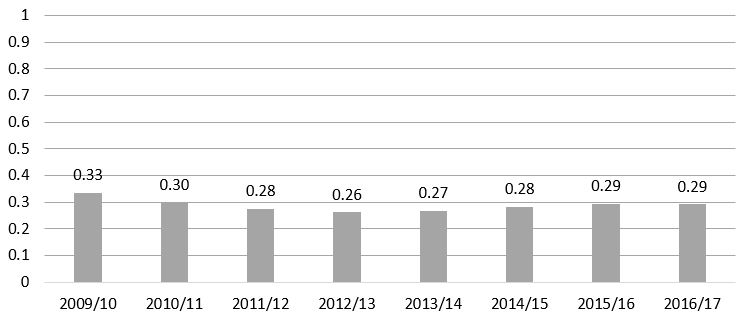
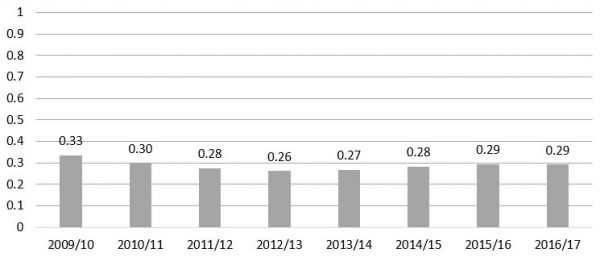
The results are shown in the graph below. Let’s start with the combined results for both the SWP and the RSE. The index of reliance on return workers is in fact much closer to zero than to one, that is, much closer to no reliance than full reliance. It is around 0.3. It has been very stable and in fact has slightly fallen since the early years of the two schemes.
Index of reliance on return workers for the RSE and SWP combined (0=no reliance and 1=maximum reliance)
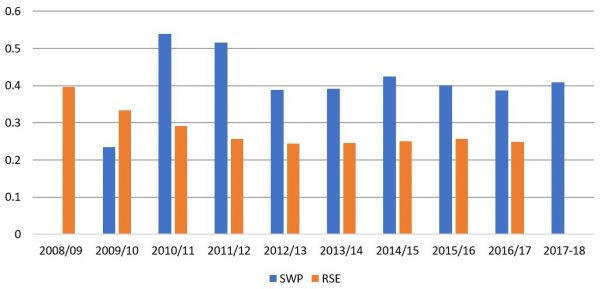
We can also compare the results for Australia and New Zealand. Surprisingly, the index is higher in Australia than New Zealand, even though the ratio of returning-to-new workers is higher in the latter. This is because in NZ the maximum potential ratio of visits to workers is much higher than in Australia: 7.5 years in NZ compared to 3.2 in Australia, based on the most recent data. This, in turn, is because the RSE has been bigger for longer and is now stable, whereas the SWP started off small and is now expanding rapidly. NZ workers have a higher average visit rate than Australian workers, but a lower rate relative to what they could have achieved if they kept on returning. The ratio of new workers to new places in the Australian scheme is just under two; in New Zealand it is never below three and often above four – another indication of the greater churn in the New Zealand scheme.
An index of reliance on return workers for the RSE and SWP separately (0=no reliance and 1=maximum reliance)
What is driving these results? What we are seeing emerge is a pattern whereby Pacific workers cycle in and out of seasonal work, going more than once, but not in general going year-in, year-out, indefinitely. Yes, both Pacific workers and ANZ employers like the prospect of return, but employers keep weeding out bad workers, and workers’ own circumstances and preferences change. Employers also change, some exiting the schemes after a while, others entering. Therefore, each year there are opportunities for new workers to join the schemes, and there is also an increasingly large pool of trained workers that employers can draw on. Of the more than 40,000 Pacific workers with seasonal work experience, at current numbers fewer than half could go in any one year, even if they all wanted to.
It should be noted that this analysis does overlook the possibility that employees will jump country. We know that in fact some workers with experience in New Zealand have decided that they can make more in Australia. They will show up in this analysis as first-time (Australian) workers, which is misleading. However, the number of such workers is still relatively low. Rochelle Bailey’s analysis of 20 ni-Vanuatu workers who started going to New Zealand under the RSE a decade ago found that only one is now working in Australia. It would also be interesting to do this analysis by nationality. Currently, data constraints prevent this.
These caveats notwithstanding, what one can say is that the existing data suggests that concerns around over-reliance on return workers have been overblown. Both the SWP and the RSE are more like schemes in which return visits are banned than ones in which maximum reliance in placed on return workers. And, measured properly, reliance on return workers is steady, not rising. What already seems to have emerged is a benign compromise in which employers get the benefits of being able to hire workers with experience, and Pacific countries the benefits of being able to share the benefits of seasonal work around.
Sending governments should refrain from putting limits on the number of times workers can go on seasonal work. There is just no need for them, and they will become simply one more complication in what is already a complex scheme.
Notes:
Total visits are annual SWP/RSE visits cumulated over time. Total SWP/RSE workers are annual new workers cumulated over time. No reliance on return workers would mean that visits equalled total workers. Maximum reliance on return workers would mean that total workers would equal the maximum number of visits in any one year up to that point of time. The NZ RSE started in 2007-08, and data goes to 2016-17. The Australian SWP started in 2008-09 and data goes to April 2017-18. Combined results are shown only for years for which we have data and the schemes were operational in both NZ and Australia.
The index of reliance on return workers shown in the final graph is defined as [average visits/workers minus one] divided by [maximum visits/workers minus one] where maximum visits/workers is visits/workers if reliance on returning workers was maximised. The index is bounded by zero and one. It is not defined in the first year of a scheme (since there is then no scope for reliance on returned workers.)
Data is from the Australian and New Zealand governments. Data and calculations available here.
This is the second in a two-part series. The first part can be found here. See also this blog.

