The release of the 2016-17 Commonwealth budget last month confirmed the Government’s plans to maintain aid at $3.8 billion in current dollars until at least 2019-20. Based on the budget’s growth projections this will mean the ODA/GNI ratio is likely to drop from 0.25% this year to 0.21% in 2019-20.
This aid funding sits within an overall budget plan that does not leave a lot of latitude for increased funding of aid or any other area of Government.
The strategy relies upon reducing total expenditure from 26.2% of GDP in 2016-17 to 25.7% by 2019-20 and limited growth of revenue, largely through income tax bracket creep, from 24.2% in 2016-17 to 25.9% by 2020-21 (see Budget Paper No 1 2016-17, p. 3-10). After that point the Government intends to limit taxation revenue to the 30-year average since 1980.
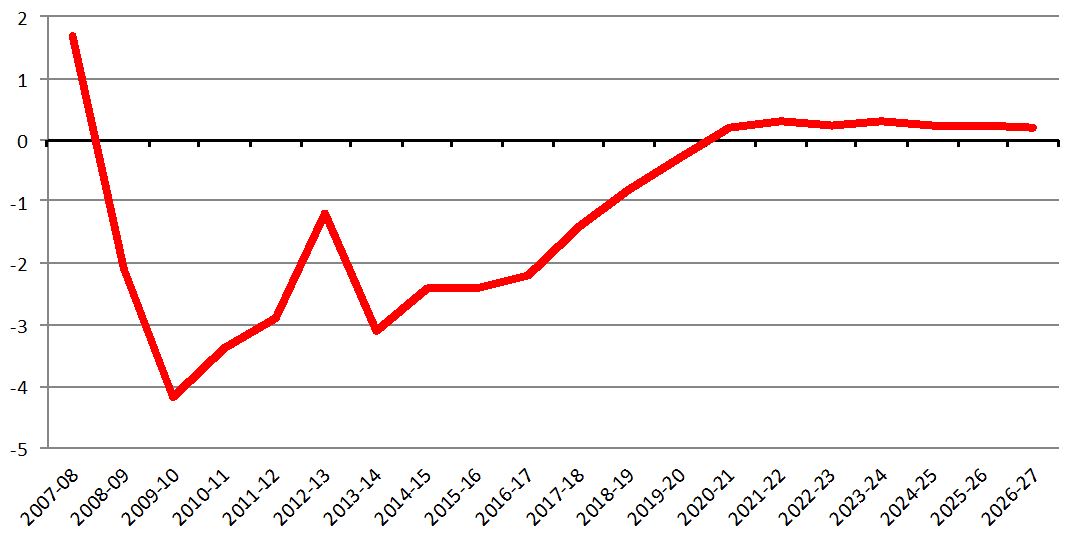
If all goes according to plan, and this depends a lot on Treasury’s relatively optimistic economic growth and commodity price projections, the budget should achieve a small surplus of 0.2% of GDP by 2020-21, a delay of one year on last year’s surplus prediction. As Anthony Swan has pointed out there has been a recent pattern for Australian Governments to be optimistic about the achievement of budget balance.
Unfortunately as Figure 1 below shows, the Government predicts that the surplus will not grow above this razor thin margin for the foreseeable future and further expenditure constraint will be necessary to reduce debt under the Government’s budget plan.
Figure 1: Australian Budget 2016-17 – underlying cash balance as % of GDP
Source: Budget Paper 1 2016-17 Table 10.1 and Chart 3.1
The result will be net debt as a share of GDP peaking in 2017/18 at around 19.2% of GDP and slowly dropping to 9.1% of GDP by 2026-27 (see Budget Paper No 1 2016-17, p. 1-5; p. 3-15) only a slow drop thereafter. As I showed in a previous blog there has never been an aid increase in share of GNI when net debt has been greater than 10% of GDP. In other words, under the Government’s budget plan the tight containment of expenditure growth, narrow surplus and sustained debt make it very unlikely that a significant increase in ODA will be considered by the Coalition, at least in the medium-term.
If the Australian Labor Party (ALP) attains government in the upcoming election they will also be operating under similar constraints. One major difference is that the ALP has not set a cap on total revenue, which could allow more space for aid increases. However there is strong pressure to increase expenditure in education, health and social security, and this may work against the ALP committing to significant growth in the aid budget.
The chart below shows how spending on the functions of government has changed since 2007-08 (the last Howard budget) as a share of GDP. Total expenditure has increased from 23.8% of GDP to 26.2% – made up largely by increases in the share of GDP spent on social security (0.8%), interest on debt (0.7%), health (0.5%) and education (0.5%).
Figure 2: Change in share of GDP for government functions, 2007-08 to 2016-17
Source: Budget Paper 1, App A1
These four areas are likely to continue to put pressure on the budget given the impact of aging on social security and health, the ALP commitment to improved education and the continuing total debt level and possibility of interest rate increases.
While the ALP has clearly stated that an increase in revenue is part of the solution to balancing the budget they also have committed to containing expenditure increases over the next ten years “for a gradual return to budget balance”.
So far the ALP has made a small pre-election commitment to increase aid by reversing the Coalition’s $224m cut in 2016-17. While a positive move, this is still heading in the opposite direction of the 0.5% of GNI target, as it is projected to result in a drop in aid from 0.25% of GNI in 2015-16 to 0.24% in 2016-17 and 0.22% in 2019-20.
In a nutshell, the Australian budget environment has changed dramatically since the two major parties made commitments to increase aid to 0.5%. In 2007-08 there was a 1.7% of GDP cash surplus, no net debt, no interest costs and total government expenditure was 23.8% of GDP. In 2016-17 there is a 2.2% budget deficit, interest costs are 0.7% of GDP and rising, and total government expenditure has risen to 26.2% of GDP.
While aid expenditure (even at 0.5% of GNI) is marginal in total budget terms, the tight budget margins and pressures to increase domestic social security, health and education expenditures make increases in the aid budget a hard sell at this time.
Increasing fiscal space for aid by reducing expenditure on other government functions, such as social security, education, health and roads, is a very tough task because of large constituencies for these functions. Even defence, despite the multibillion dollar expenditure on submarines and such, is not overspending when compared with most other comparable countries.
A better option may be identifying “taxation expenditures” (tax exemptions, deductions, concessions and rebates such as tax-free super payments, negative gearing, capital gains discount and the diesel fuel rebate) that could be curtailed to increase revenue. Cutting those taxation expenditures that provide “middle-class welfare”, or that support environmentally or economically destructive policies, are likely to be broadly supported and could reduce pressure on the budget.
Encouraging simpler and more efficient taxes, reducing tax avoidance and arguing against planned tax cuts are also important steps to help achieve budget balance and be able to meet our international aid commitments.
Garth Luke is a consultant researcher and writer on aid and development policy.


Thanks Luke for this interesting analysis. I often wonder if Australians are generous. In a report by the UK-based ‘Charitable Aid Foundation’, based on ‘all ATO tax returns that itemised a donation’, Australians gave $2.2 billion of donations in 2012. The government forgoes income tax revenue on a proportion of this money. Australia is ranked 11th in the world (individual giving as a % of GDP), behind (in order) USA, NZ, Canada, UK, Republic of Korea, Singapore, India, Russia, Italy, and the Netherlands. Ref here in ‘GROSS DOMESTIC PHILANTHROPY: An international analysis of GDP, tax and giving’. CAF, January 2016