



Average life expectancy across the Pacific is 68.8 years, up from 52.7 in 1960. That’s a significant increase, but it is well below the rate of progress that middle-income countries as a group have achieved. The average increase for the PICs is 16 years, whereas for lower-middle income countries the average increase is 23 years and upper-middle income countries 19 years.
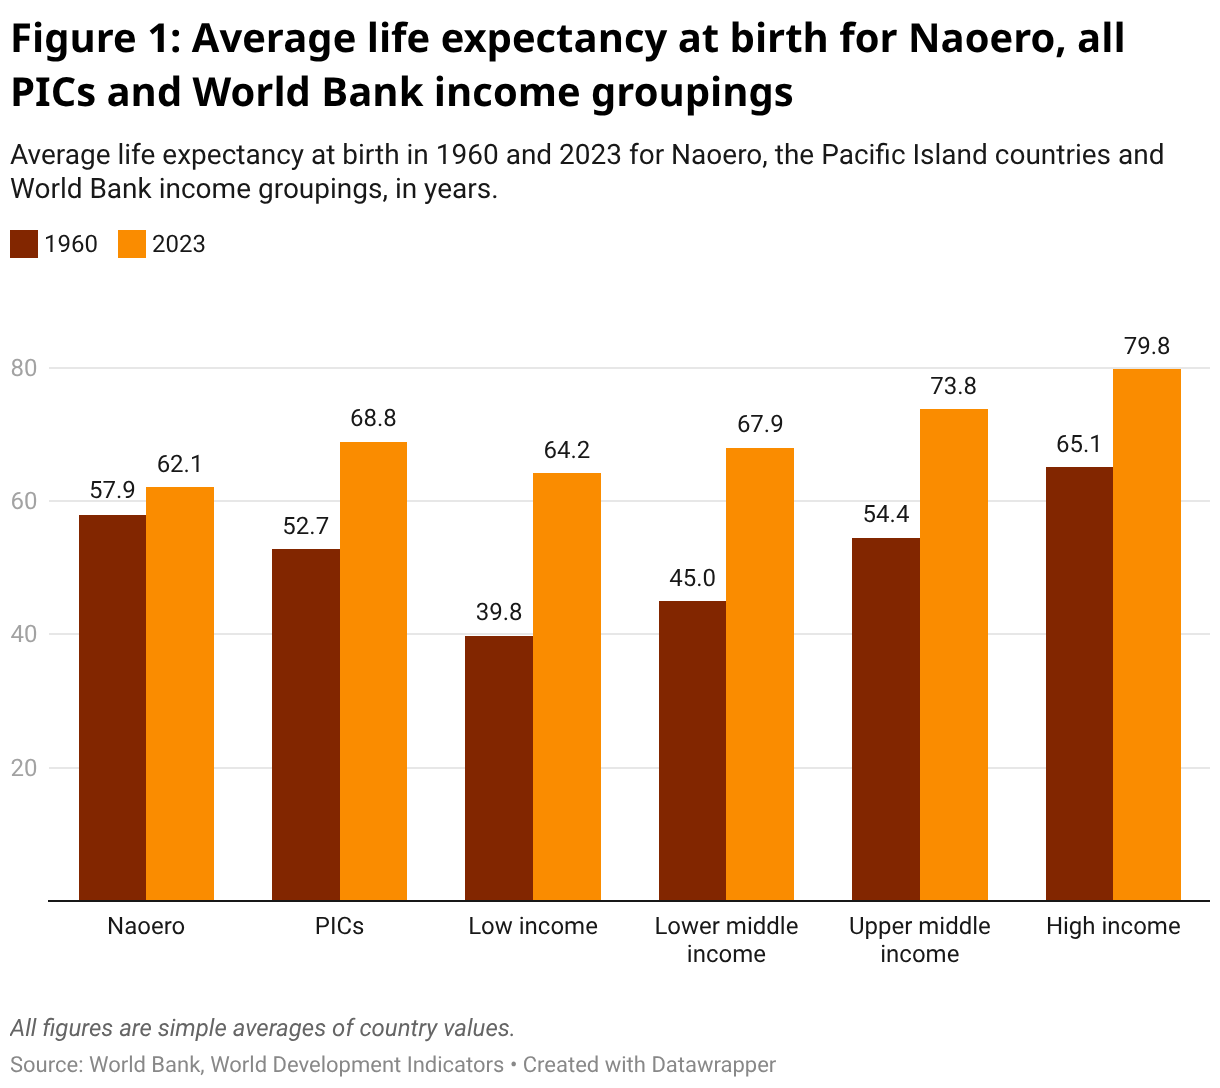
Naoero’s improvement in life expectancy has been particularly modest, even by Pacific standards.
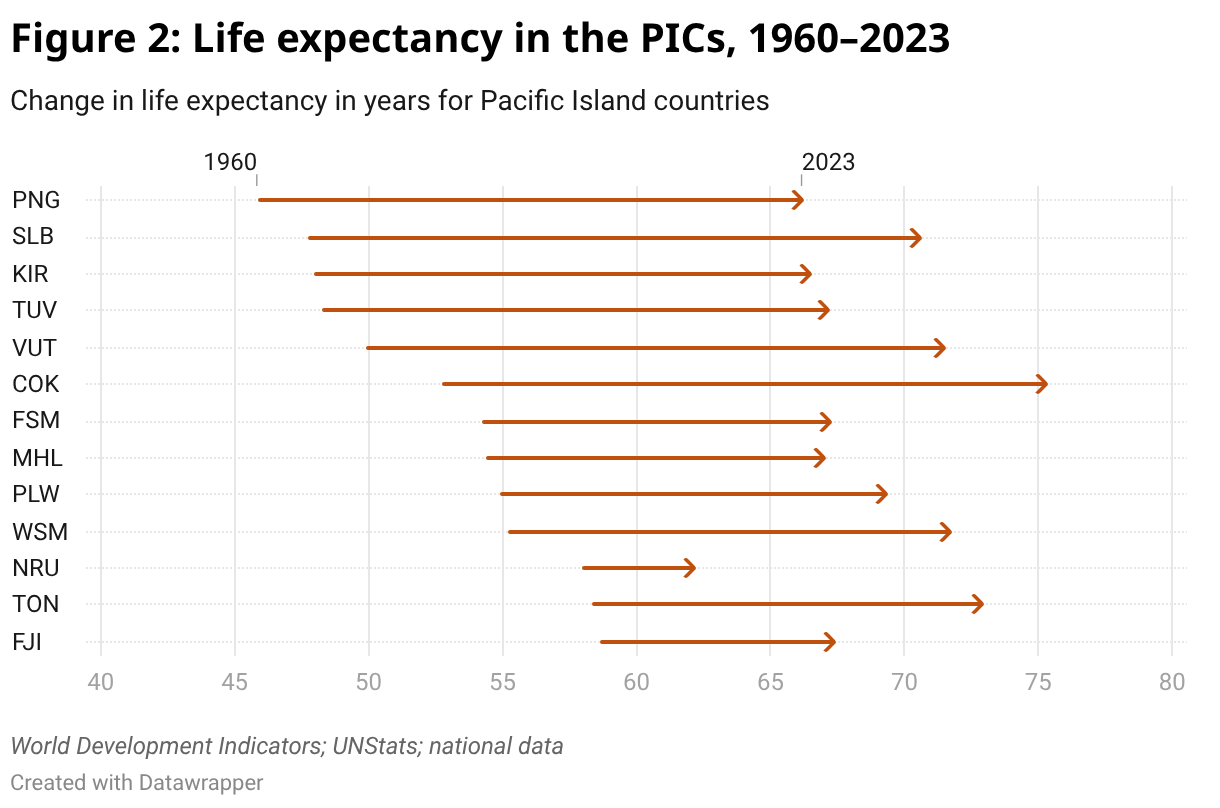
In 1960 Naoero’s life expectancy was above the upper-middle-income average. Now it is below even the low-income average. Naoero has gone from having the Pacific’s third-highest life expectancy in 1960 to having its lowest in 2023. And it is the lowest by a long way: four years.
The relative standing of other countries has also changed. Fiji has gone from having the Pacific’s highest life expectancy to being below average. Marshall Islands (MHL) and the Federated States of Micronesia (FSM) have both gone from being above average in terms of life expectancy to below average. At the other, more positive end of the performance spectrum, Cook Islands has gone from having an average life expectancy to having the highest in the Pacific. Solomon Islands and Vanuatu have both gone from below average to above average.
The lack of a relationship within the Pacific between life expectancy at earlier and later points in time is quite different from what one finds at the global level, where more than half (56%) of the variation around the world today in life expectancy can be explained by looking at life expectancy in 1960. For the Pacific that figure is essentially zero (0.2%).
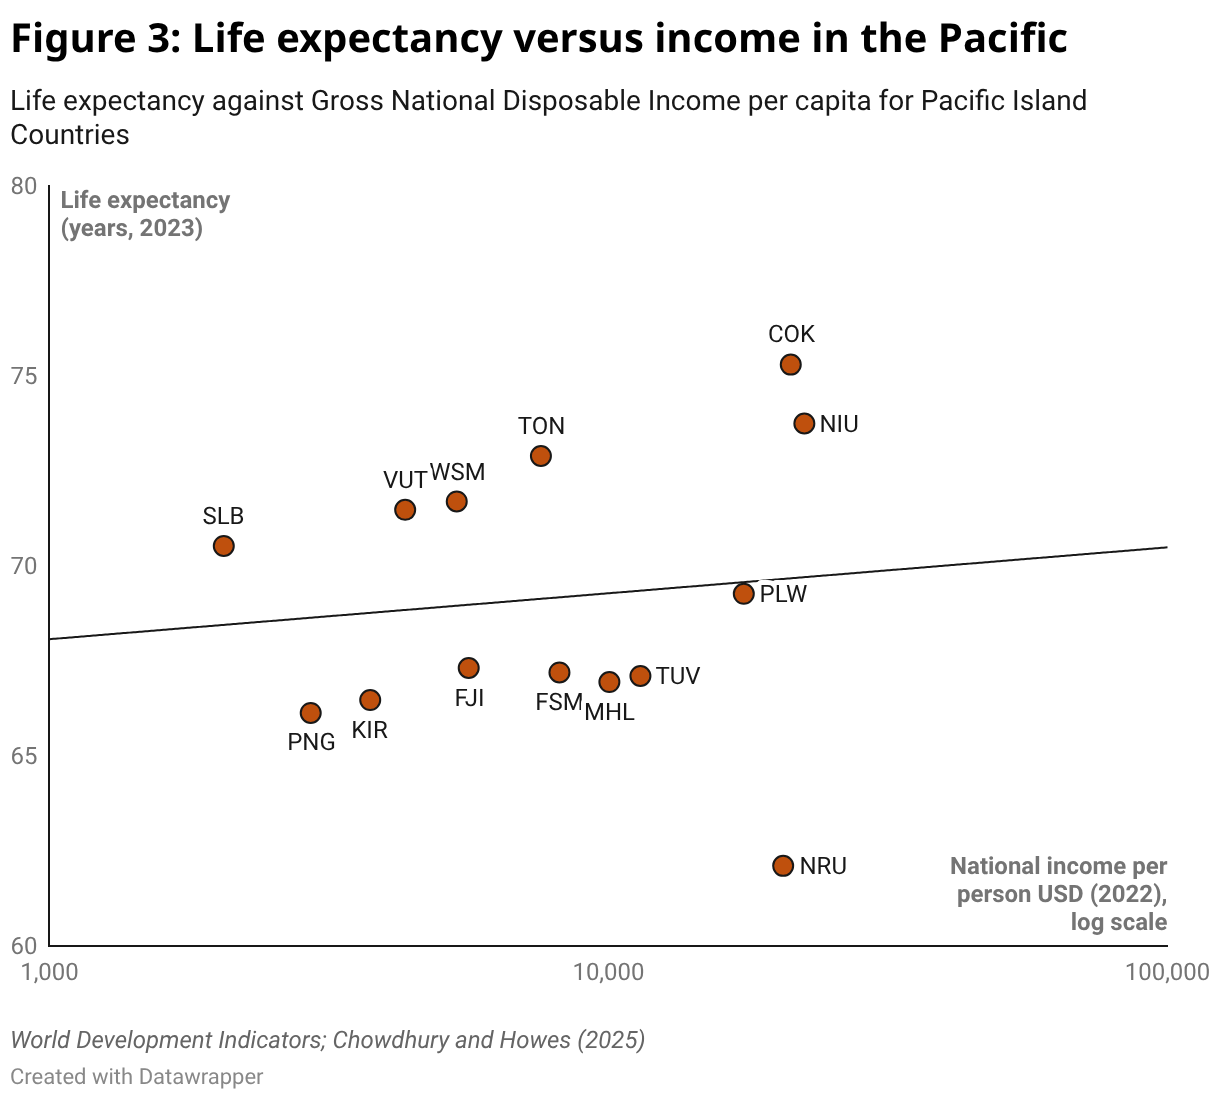
The relationship between income levels and life expectancy in the Pacific is also weak. For the world as a whole, two-thirds (67%) of the variation in life expectancy can be explained by variation in income; for the Pacific though, variation in income explains only 1.5% of the variation in life expectancy, that is, almost not at all.
What explains Pacific variation and performance in life expectancy? A full explanation is well beyond the scope of this article. There may be problems with the data. Ian Anderson has written extensively on this blog about the medical challenges the Pacific faces, in particular the high and growing levels of diabetes and the need for lifestyle and dietary changes.
One point we can make is that the correlation in the Pacific between income and life expectancy improves a lot if Naoero is removed from the sample.
While Naoero is a high-income country now, it endured a severe decline in income and consequent hardships during its “riches to rags” story of the 1980s,1990s and 2000s. More than one in five adults has diabetes, among the highest rates in the world. Some argue that Naoero is still paying the price for phosphate mining, including in terms of poor air quality.
To its credit, Naoero is actively trying to improve the health of its citizens, with extensive exercise promotion campaigns. More controversially, last year the country took the radical step of handing over management of its health system to a foreign company, the UAE company Global Mission Support Services.
It is too early to say whether this agreement will last and whether it will make a difference. But running a health system in a tiny and remote island country will always be a difficult task. Unlike the other high-income countries of the Pacific, Naoero’s citizens have no open migration pathway; a small allocation under Australia’s ballot-based Pacific Engagement Visa is the only preferential access they have. This means that overseas health care is both difficult to obtain and expensive.
The two countries with the highest life expectancy in the Pacific, Cook Islands and Niue, both have unlimited migration rights to New Zealand. Indeed, all citizens of these two PICs are entitled to New Zealand passports. It won’t be a complete answer to its problems, but Naoero might benefit significantly, not just economically but in terms of health outcomes, by negotiating a similar deal with Australia.
Notes: Life expectancy data are from World Development Indicators (July 2026 release), except for Cook Islands which is from UNStats, and for Niue which is from national data. Niue data are only available for 2023, not earlier years. Income group averages are simple averages of the countries in each World Bank income group, using the Bank’s 2026 classification. National income data is measured using Gross National Disposable Income (GNDI) from Chowdhury and Howes (2025). Diabetes prevalence figures are from the 2024 NCD Risk Factor Collaboration study.







Very interesting blog, including the discussion about factors that might explain the increases — or decreases — in life expectancy. Readers of this blog might also be interested to know that the Institute for Health Metrics and Evaluation (IHME) posted a blog this month on differences in life expectancy, and differences in causes of death, among the countries of the Association of South East Asian Nations (ASEAN). The IHME blog notes, for example, that in 2023 regional life expectancy was 70.1 years for males and 76.2 years for females, ranging from 87.5 years for females in Singapore to 62.1 years for males in Myanmar (95% uncertainty intervals are recorded for all statistics cited in the IHME blog). The IHME blog also identifies some noteworthy trends in causes of deaths. As just one example, the IHME blog explains that “road injuries were the primary driver of mortality among males from adolescence through to early adulthood, accounting for 25.0% of total mortality in males aged 15–19 years, with mortality rates varying from 3.0 per 100,000 population to 49.0 per 100,000 population.” The IHME blog is available here.