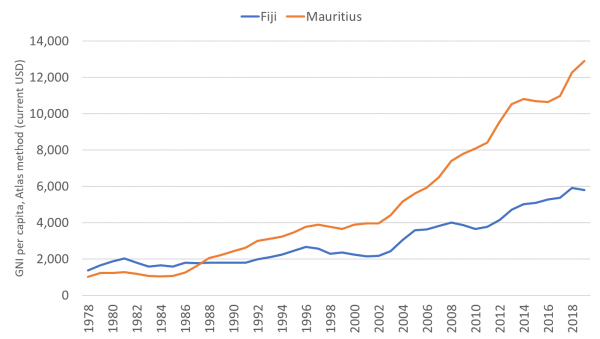
Both Mauritius and Fiji are remotely located islands situated far from global business centres, both developed as sugar plantation economies, but their economies have taken drastically different paths over the last half a century. Last year the World Bank reclassified Mauritius as a high-income country. Its 2019 income (GNI per capita) for the first time exceeded the US$12,535 threshold for that category. Fiji meanwhile continues to be classified as an upper-middle-income economy, with its 2019 GNI per capita of US$5,800 at just 46% of the high-income threshold. While Mauritius may lose the high-income tag temporarily as a result of COVID-19, we thought its achievement would be a good time to revisit the topic of Fiji-Mauritius comparisons: Biman Prasad wrote a paper in 2012 explaining why Fiji is not the Mauritius of the Pacific, and Satish Chand blogged on the subject in 2010.
Fiji (current population of 0.9 million) and Mauritius (current population of 1.3 million) became independent in 1970 and 1968, respectively. As Figure 1 shows, in the late 1970s and early 1980s, Fiji was actually richer than Mauritius. Now Mauritius has more than twice the income of Fiji.
Figure 1: Fiji and Mauritius: GNI per capita (current US$)
Mauritius has grown faster than Fiji every decade from the 1980s (which was disastrous for Fiji) to the 2000s, as revealed in Figure 2. Fiji did better in the 2010s, but its growth was slowing even before COVID-19. Even at the rates of the last decade, it will take at least four decades for Fiji to catch up to Mauritius.
Figure 2: Fiji and Mauritius: average growth (GDP per capita) per decade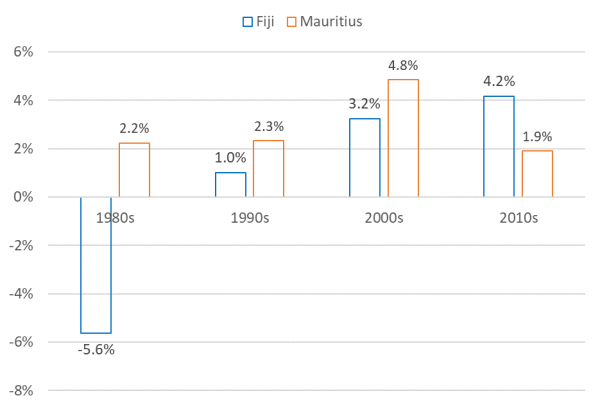
It’s not all about the money. Life expectancy also used to be higher in Fiji. Now the average Mauritian can expect to live for seven years more than the average Fijian: 74 versus 67.
Figure 3: Fiji and Mauritius: life expectancy at birth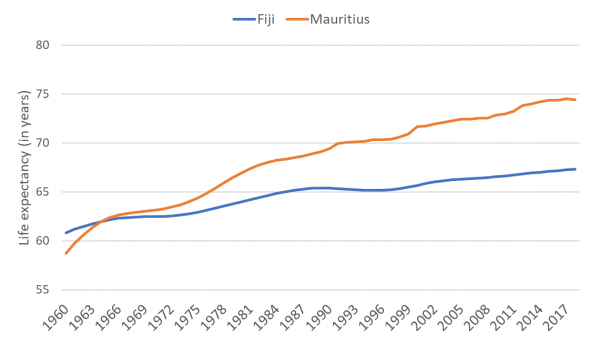
Interestingly, Fiji has caught up with Mauritius on education, and the countries now have similarly educated workforces. The real issue for Fiji is getting a higher return on its education investments.
Figure 4: Fiji and Mauritius: skilled labour force (as % of labour force)
Fiji is famous for being a country of out-migrants. Mauritius used to be as well, but its net outward migration rate has slowed right down in recent decades, as families have voted with their feet, and decided to stay. By contrast, migration rates increased in the 1980s in Fiji, and have been high since.
Figure 5: Fiji and Mauritius: net migration per capita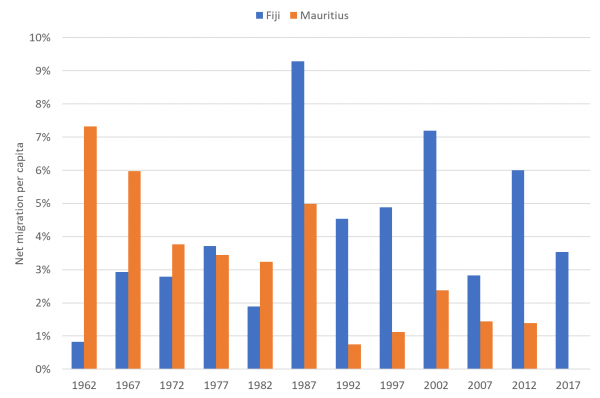
Turning to politics, the Polity5 index measures the extent of a country’s adherence to liberal democratic norms. As shown in the next figure, this index puts Mauritius well above Fiji, with the former’s democracy strengthening (reaching the highest score possible in 1980 and staying there) and the latter’s weakening over time. The figure clearly shows the negative influence of Fiji’s four coups: in 1987 (two), 2000 and 2006.
Figure 6: Fiji and Mauritius: democracy scores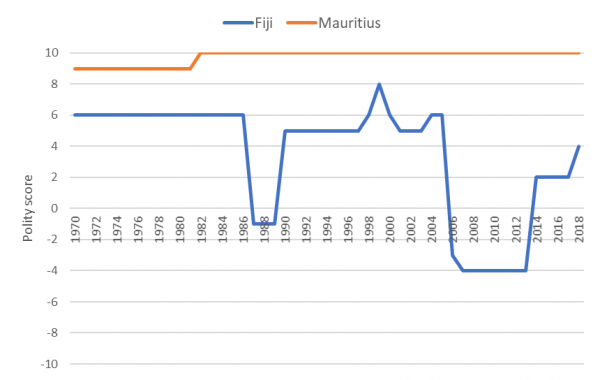
So, Mauritius has outperformed Fiji economically, socially and politically. The next blog tries to explain why.
Notes
[1] In Figure 1, to enable better comparability between different countries’ GNI per capita trends, the Atlas method is used by the World Bank to smooth out short-term exchange rate and price fluctuations.
[2] Source for Figures 2 and 3: World Bank.
[3] To convert data for Figure 2 into 2019 USD terms, the nominal exchange rate was used to first convert from local currency units to current USD terms. The USD GDP deflator was then used to convert to 2019 USD terms. The PPP conversion factor stretches back to 1990 only and nominal LCU/USD exchange rates were therefore used as a proxy to obtain a longer series. The annualised growth rate for each decade is the ratio of the GDP per capita of the last year of the decade (example: 1989) and the first (example: 1980), raised to the power of 1/9 and subtracted by 1.
[4] Source for Figure 4: UNDP. Due to data limitations, 2010 figures for Mauritius were compared with 2011 figures for Fiji. The figure shows the percentage of the labour force aged 15 or older with intermediate or advanced education, as classified by the International Standard Classification of Education.
[5] Source for Figure 5: World Bank. Data points are five-year estimates published by the World Bank. Positive numbers in the figure imply that emigration exceeded immigration. According to World Bank data, Mauritius had zero net migration in 2017.
[6] Source for Figure 6: Centre for Systemic Peace. Fiji’s polity score in 2000 was actually -88 and its Polity2 score of 6 is used instead. The score of -88 is a standardised code to indicate a transitional period for a country. According to the Centre for Systemic Peace manual (p.17), the Polity2 score converts standardised codes such as -88 to the conventional -10 to +10 range.
Auty (2016) has analysed Mauritius’ growth trajectory in his paper.
This is the first in a two-blog series on #Fiji-Mauritius comparisons. You can find the second blog here.


`Such comparisons are interesting. Countries naturally want to know why others have done better than them. I look forward to reading your more penetrating analysis’.
`Interesting’ maybe for economists who delight in making them, in the hope that they will be policy influencers. As for `countries naturally’ you presumably mean economists trained to be a-, even anti-,historical `naturally’: serious analysis is usually undertaken by people trained in other disciplines, including history and philosophy.
One of the funniest, yet saddest books I have ever read in this comparative policy prescriptions genre is by Acemoglu and Robinson Why Nations Fail. Of the USA, American Indians `sidelined’ to make an egalitarian paradise possible? Sheltered in their ivory towers, it may be possible to describe the colonial treatment of indigenous Americans as just an act of `sidelining’ but few others would agree except other white supremacists and apologists. As for US and other European imperialism’s continuing effects on why people are poor world-wide, the word doesn’t even appear in the book’s index. Colonialism, only appears as `the end of’. (My point applies to accounts of Mauritius and Fiji which either deliberately or out of ignorance ignore imperial and colonial history and the continuing effect on national political economies.)
Whether my analysis is penetrating will leave to others to decide, though doubt most economists will read anything I write. For others, I have an essay on labour mobility schemes accepted for publication and another on land tenure in PNG out for review. Comments always welcomed.
What a hoary old, facile comparison and no better than the Biman Prasad and Satish Chand efforts. A bit like Helen Hughes comparing PNG with Botswana and South Korea.
Hi Scott, Your mention of the PNG-Botswana comparison reminds me of the PNG national plan from a decade or so ago that early on compared PNG’s growth with Malaysia’s and Botswana’s. Such comparisons are interesting. Countries naturally want to know why others have done better than them. I look forward to reading your more penetrating analysis. Regards, Stephen
Excellent post. It seems the economic damage of Fiji’s ‘brain drain’ is huge.
I am curious to learn if Fiji’s policy of keeping wage rates low has also hindered economic development.
Very interesting. Sometimes Fiji fancies itself as the Singapore of the Pacific, at other times as the Mauritius of the Pacific, with even some talk of one day emulating Australia and New Zealand. But the results say otherwise.
That it will take Fiji four decades to match Mauritius shows just how far behind we have fallen. Of course the social and political contexts are very different. For one, there is no major conflict between descendants of an immigrant group and an indigenous population which fears political and economic marginalisation. There is no oversized military with a huge budget and a penchant for coups.
Fiji Governments, including the present one, have tried hard, with a measure of success, but Fiji is not an easy county.
Still, the comparisons are telling in many respects, and perhaps a reminder of what could have been.
Looking forward to the next blog.