

A significant amount of Australian aid is delivered by private sector contractors. This blog asks two key questions. What share of contracts go to Australian contractors? And how competitive is the contracting market?
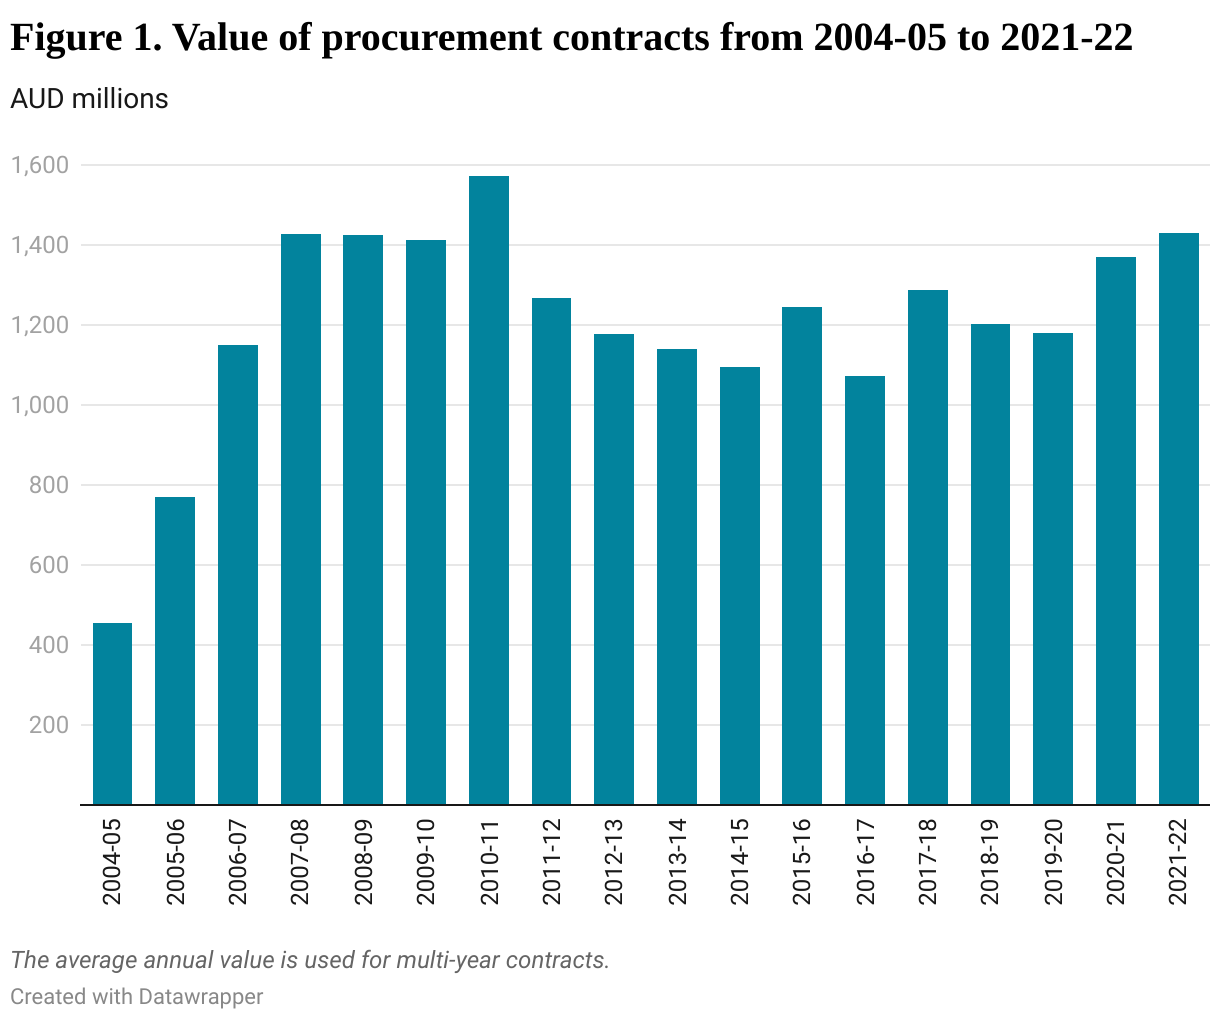
The blog is based on my analysis of procurement data for the Australian aid program from AusTender, from 2004-05 to 2021-22. In 2020-21, the estimated annual procurement value (adjusting for the fact that nearly half of the contracts are multi-year) was $1.37 billion, or about 30% of Australia’s aid budget. This is larger than the official figure of aid flows to commercial suppliers (21% in 2020-21) due to differences in calculation methods, as the latter is calculated by adding up total value of new contracts awarded in the year and extensions of past contracts.
This gives us some assurance that the data is comprehensive. The analysis that follows is conducted in terms of total contract value rather than imputed annual amount unless otherwise stated. We define an Australian supplier as a supplier registered in Australia.
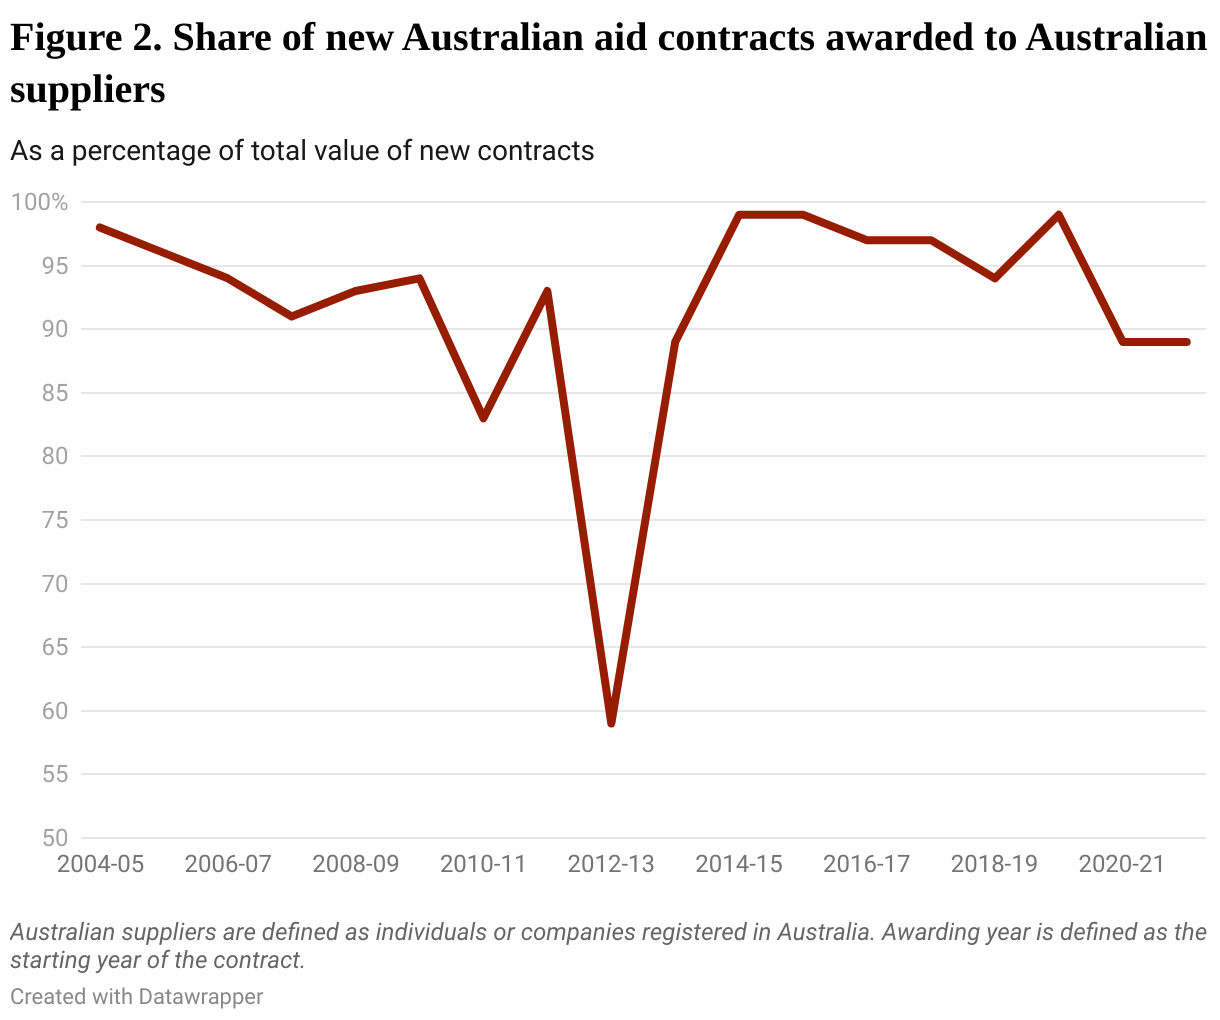
The share of contracts awarded to Australian suppliers dropped significantly after the Australian government officially untied its aid and allowed international tenders, in April 2006. It reached a low point in 2012-13, when Cowater International from Canada and Research Triangle Institute from the US received 33% of the total value of contracts awarded. However, the share of contracts going to Australian suppliers soon picked up again and has remained above 90%. Companies registered in developing countries have received only about 1.2% of total contracts each year over the past decade.
Compared to other DAC (Development Assistance Committee of the OECD) donors, Australia has a high share of contracts awarded to domestic suppliers. While such a high share is often associated with the formal tying of aid, in Australia this is not the case. In principle, Australian aid is untied: all suppliers are allowed to participate in tendering regardless of where they are registered. So why are Australian-registered companies more likely to win the contracts?
There are three reasons. Most Australian aid is provided to the Pacific Islands and Southeast Asia, where Australian companies have a lot of experience. The Australian government has also increasingly preferred to tender large aid contracts (see below), which advantages national suppliers. Finally, many Australian aid contractors are now affiliated with international partners or are themselves multinationals.
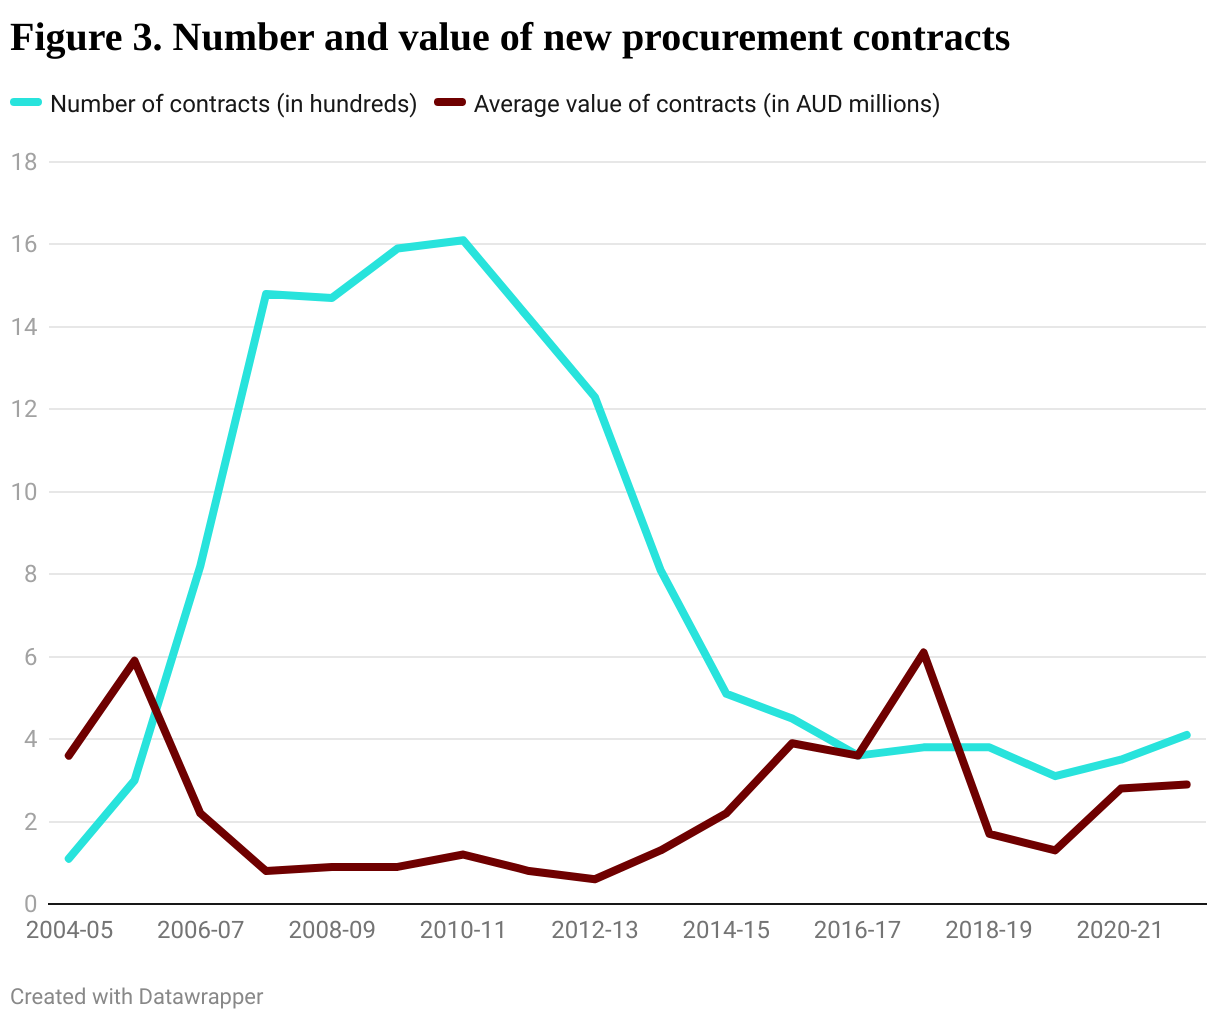
In 2014, the Australian government set the target of reducing the number of individual investments by 20% by 2016-17 in an effort to reduce fragmentation, cut administrative costs, and improve the operating efficiency of the aid program. Facility arrangements were increasingly used to group together multiple investments into a facility under a single contractor. As a result of this change and overall aid cuts, the number of new procurement contracts awarded each year since 2014-15 was only a quarter of the pre-announcement level. Meanwhile, contracts became bigger and longer. The average contract value more than quadrupled from 2013-14 to 2017-18, before falling again, perhaps because facilities fell out of favour.
A direct result of the shift to larger contracts and use of facilities has been the increased concentration of the aid contracting market. Concentration of the contracting market has also occurred through mergers and acquisitions. The competitive landscape has changed considerably as the number of contracted suppliers with active contracts dropped from 900 a decade ago to around 250 in 2021-22.
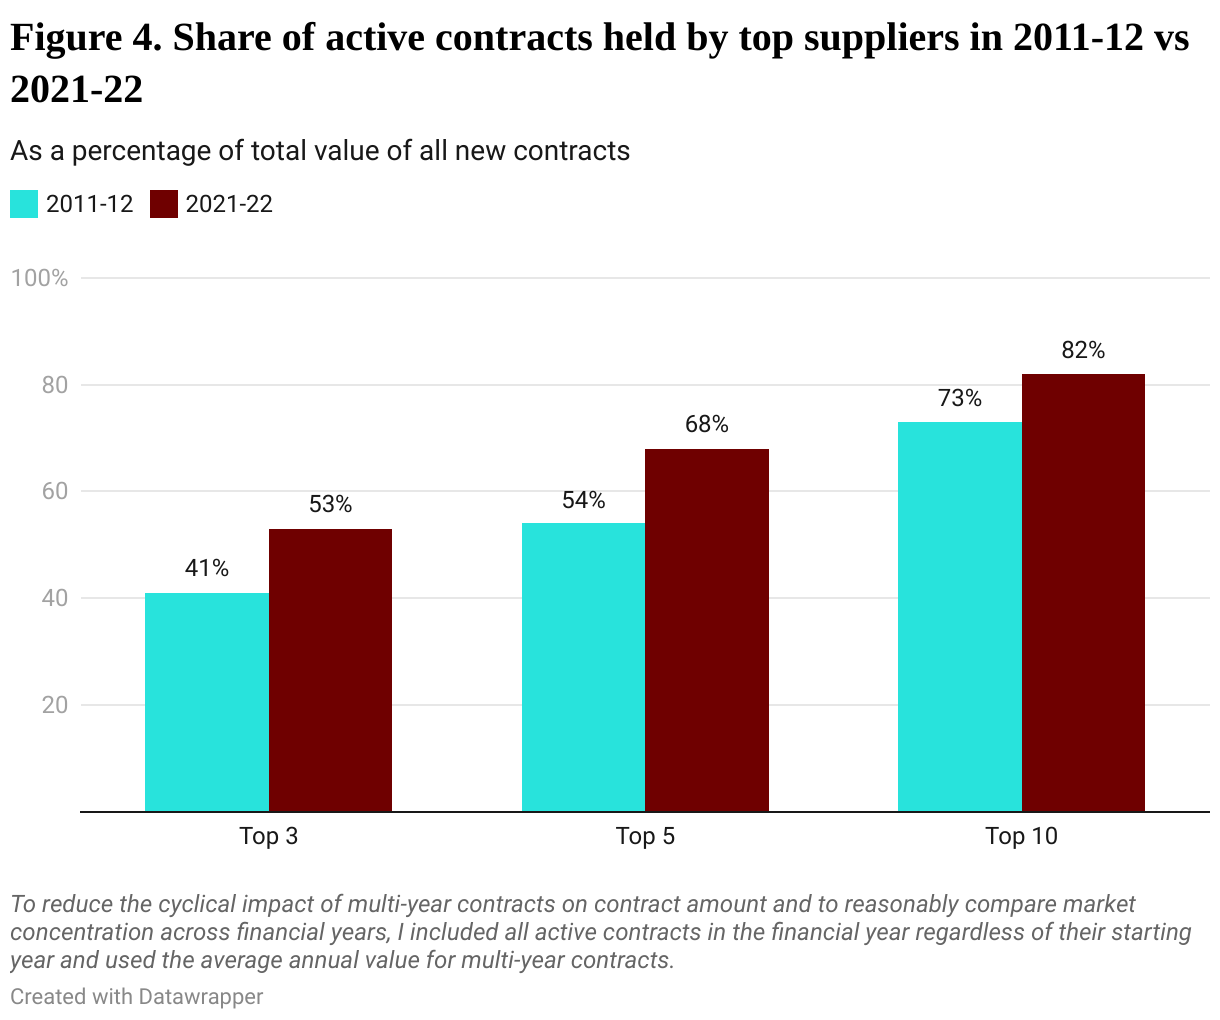
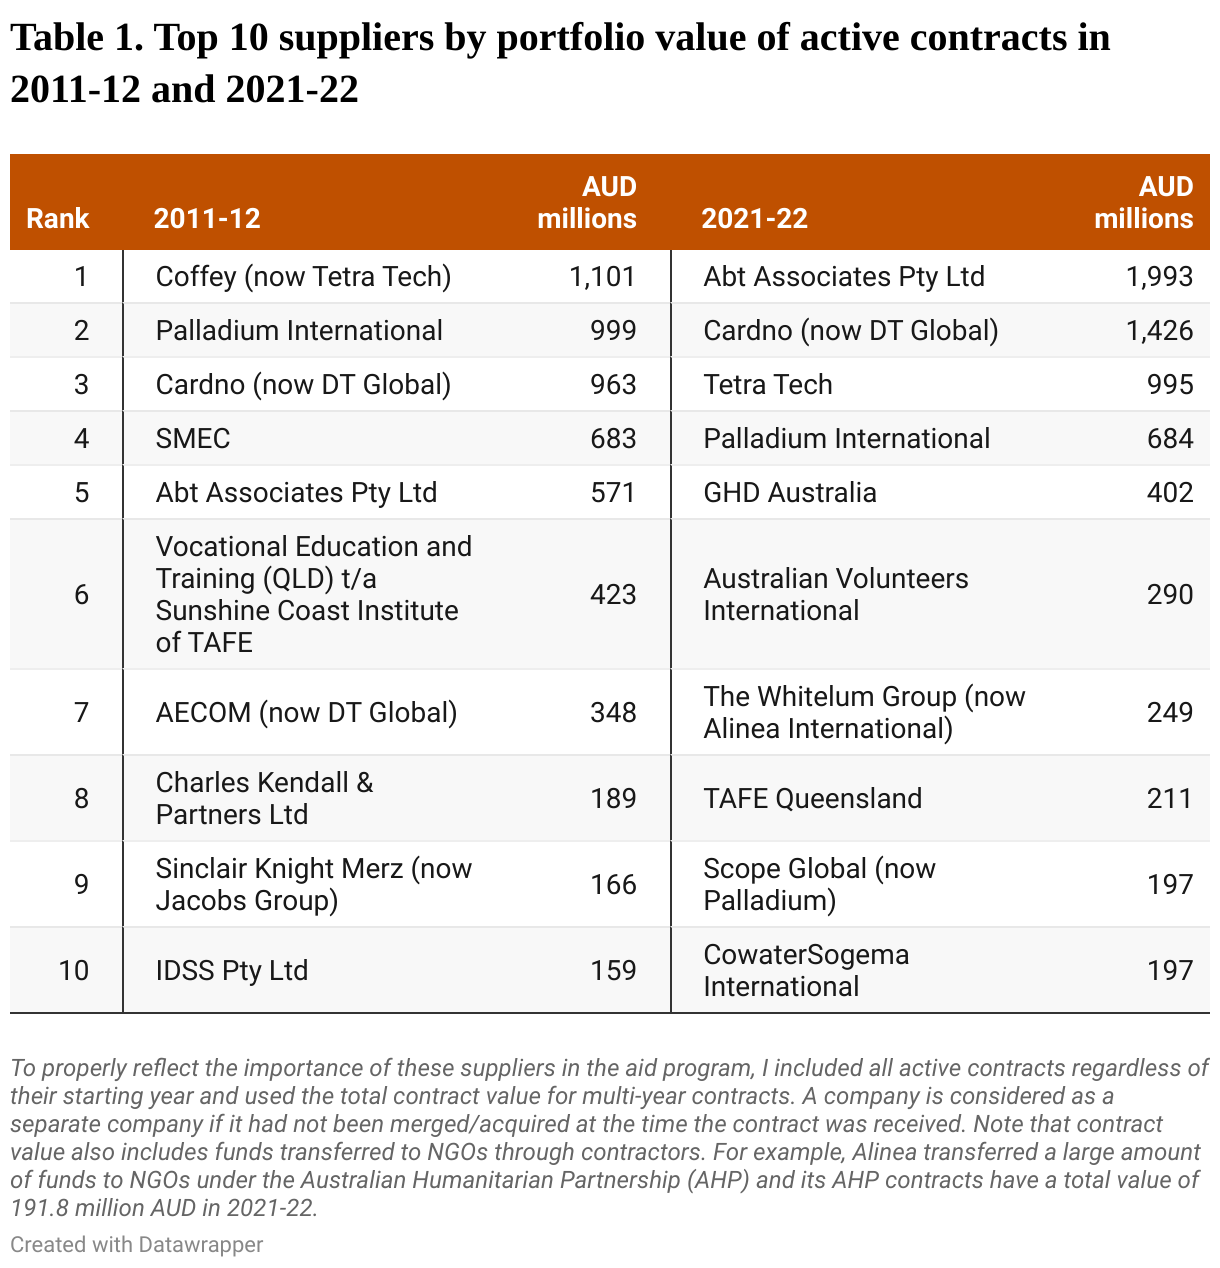
The growing number of large contracts favouring large contractors, and mergers and acquisitions between companies, have made the big players a lot more powerful. From 2011-12 to 2021-22, the market share of the top three suppliers increased by 12%, the top five by 14% and the top ten by 9%. And in 2021-22, the top ten out of a total of 255 suppliers accounted for over 80% of the market.
Although there is churn among the smaller suppliers, over the past decade, four of the top five suppliers have maintained their leading positions in the aid contracting market. These are Abt, Cardno (now DT Global), Coffey (now Tetra Tech) and Palladium. Two of them had portfolio values from all their active contracts in excess of $1 billion in 2021-22, well above the rest of the suppliers, with Abt almost hitting the $2 billion threshold.
Two clear conclusions can be drawn. First, a remarkably high share of Australian aid contracts goes to Australian-registered companies. And second, the Australian aid contracting market is becoming increasingly dominated by a small group of firms.


Interesting observations, Sharon, with thanks. What might happen if instead of defining an Australian supplier one ‘registered in Australia’, they were defined by country of ownership? Nearly all of the key suppliers of large, multi-year contracts for DFAT are overseas-owned entities, not Australian-owned as is commonly understood. Food for thought.
Hello Tamara. That’s a good point. So far we haven’t looked into companies’ country of ownership as it requires a huge amount of manual work. But I agree it would be interesting to check that. Thank you for raising it.
Lots of interesting information and insights here, Sharon. Thanks for your work.
As you state in the article and in responses the data raises as many questions as answers, so there’s lots still to unpack. It’s important members of the development community do so dispassionately without bringing prejudices into the mix. With this in mind we really need comparable analysis that looks at the community sector and NGOs and also multilaterals.
There’s a shared interest in having sufficient diversity of suppliers of all types to maintain the benefits of competition (which are real and substantial, even if anathema to many in the sector). Diversity, of course, should be a means to the bigger goal of greater development impact. Maximising the number of providers would actually be detrimental to that goal because not all providers are of equal quality. Into the bargain, an under-resourced DFAT struggles to manage existing contracts, grants and relationships. If these are multiplied so are its difficulties in managing strategically for results. Multiple dilemmas. No easy answers.
Here’s another dilemma that many wont want to contemplate. One of the reasons for market concentration, despite untying, is that profits in the industry are typically low. Quite frankly I wonder why quite a few of the firms – and individuals – bother, as the returns are often less than 5%. The answer usually is that the companies and in particular the people who work on them are just as committed to development as others in the sector. Imagine that, people in the private sector who also have values and who are motivated by a whole range of factors not only profit maximisation. Turns out there’s less black and white and plenty of shades of gray.
Thank you, Richard. That’s very good information. I didn’t expect the return to be so low. I wonder if low competition would have contributed to less innovation, higher costs and thus lower returns. You are right there are tradeoffs and dilemmas, and so much more to unpack. Again thanks.
Thank you Huiyuan. An interesting read. As and when the information about sub-contracting becomes available, it will be great to know about the level of involvement of local (Pacific Island countries) companies.
Thank you Levin. We will follow up on the release of sub-contracting data.
Thanks Huiyuan Liu. There is a lot of interest in your article. And, for a little nostalgia, the following data is from a 2005 AidWatch Report, called ‘The Boomerang Effect’: https://aidwatch.org.au/wp-content/uploads/2014/06/2005-CoA.pdf
The top 10 contractors by $s in 2003/04 (in order) were reported as: ACIL ($313M), SAGRIC, Hassall, GRM, IDP, Melbourne Uni, IDSS, URS, GHD ($64M). ‘All other contractors’ managed 49% of the money and 86% of the # of contracts that year.
Thank you Rod. That’s helpful to know. The top contractor list back then is quite different from our list in 2011-12, so the aid contracting market then was a lot more liquid than it is now.
Hello Huiyuan, thank you for posting your interesting analysis. As CEO of the International Development Contractors’ Community (IDCC), I’ll make a couple of observations.
1. DFAT’s use of managing contractors enables the aid program to deliver resources through a broad range of implementing partners, including local experts and companies, local and international NGOs, and other companies and individual consultants. As noted in the article, DFAT took deliberate steps several years ago to reduce the transaction costs associated with directly contracting a multitude of smaller projects, and instead opted for larger programs (and so-called facilities) contracted to companies who would manage a range of smaller activities within larger programs.
2. The contract values can be misleading, as these amounts represent the entire value of the program (or facility), and include large amounts of funds that are “passed through” to subcontractors, either as grants or sub-contractor payments.
3. The “pass-through” of funds to grant recipients and sub-contractors is managed by the managing contractors in a way that ensures DFAT’s compliance, risk and safeguard measures and accountability requirements are met. This is critical in protecting the integrity of the aid program. The contractors are subject to a rolling program of audits and due-diligence compliance checks by DFAT to ensure these integrity measures are upheld all the way down the supply chain.
The IDCC represents small, medium and large organisations with an interest in the Australian aid program, as well as individual consultants/sole traders.
Hello Jane. Thank you for the explanations. I agree that the entire contract value does not just go to the pocket of one contractor, but the value would to some extent reflect a major contractor’s strong negotiation power and significance in the aid program. I understand your concerns and I tried to make it clear in notes and text when I wrote the blog. Unfortunately, only total contract values are available for analysis, and I have to stay with that. I do hope DFAT will publish subcontracting data. That would definitely help the analysis to tell a more comprehensive story. Also it is good to know that DFAT has put in those monitoring procedures. It would be very helpful if the documents are public and processable.
Very interesting article and research. Thank you for sharing. I believe there is room to grow and also ways to understand Pacific based local consultant firms to improve the ways of working and ensuring aid trickles down to the needy and meaningful partnerships.
Thank you Ruth. I agree. And there remains much work to be done to improve our understanding.
kia ora Huiyuen
Thank you for sharing this, very interesting. Would be interesting to know how many of these also sub-contract local consultancies based in the Pacific (I say this having done several sub-contracts for these larger companies) – so yes they may get the contracts, but they also sub-contract some of that work to local companies as well….
Thank you Alison. At the moment we don’t have access to subcontracting data. DFAT does claim that Australia has transferred benefits to the recipient countries through subcontracting, but there is no evidence to quantify the scale yet. Hopefully DFAT can make their data available to the public soon.
Thank you so much Huiyuan Liu for this incredibly valuable piece. Lots of opportunities to dive deeper. As a small consulting firm in Fiji (Talanoa Consulting) with almost of all of our team and subcontractor network being Pacific Island experts, we have experience of both being supported by some of these larger firms through subcontracting models and have felt as though we have been included, tokenistically, to demonstrate that they have partnerships in the Pacific. Part of the power of the larger firms is their ability to ‘be in the Canberra bubble’, to know what is coming and position themselves accordingly. Procurement rules, as contracts have got larger, also favour firms with business development teams who are experts in tenders, something smaller firms in the Pacific don’t have the resources to support. It would be great to delve deeper to find out how much each of these giants subcontract locally to other firms, rather than just growing their own offices and staff in partner countries. Would love to have a future talanoa about this! Thanks so much for pulling this together.
Hello Marita. Thank you for sharing your experience and perspective. Knowing this is very helpful. It is disappointing to see that some valuable local partnerships through subcontracting have even failed to realise their underlying values. This provides more reasons for DFAT to rethink its approach to localisation.
Hi Sharon, this is great and very interesting analysis.
A couple of other things that could contribute to the high % of Australian companies winning – tenders have a requirement for demonstrating the benefit of their proposal to the national interest, as well as an Indigenous Participation Plan. International companies can struggle on these elements compared to Australian companies. The new emphasis on localisation and requirement for localisation statements/plans in tenders also supports companies that have an existing footprint in key Indo-Pacific countries.
Australian companies have also been stronger at capturing some of the expertise that has left AusAID/DFAT, so can put named personnel on their bids that already have a strong/known reputation among those assessing proposals, and significant regional experience. International companies in general don’t have the same level of Pacific expertise. It would be interesting to see if there’s a difference between contracts awarded in the Pacific, and S&SE Asia, for example? On a hunch I feel like there’d be more diversity of suppliers in S&SE Asia, but the contract values smaller on the whole.
But I think the big reasons you’ve identified are more significant, these are just a couple of smaller elements that might contribute.
Also a note for your table on changes/acquisitions, AECOM became DT Global in 2019, then DT Global acquired Cardno in 2022, at the end of the financial year. I’m guessing in the 2021-22 figures you’ve combined Cardno and DT Global? Might be worth clarifying.
And as Darian pointed out, Scope now part of Palladium.
Thank you Ashlee for your information. That’s another transparency issue, again. There’s very limited information on the contractor selection criteria. I wonder how much weight it put onto national interest, localisation and inclusion of experts. It would be interesting to see how the adjustments in selection criteria affect project outcomes.
I agree that a comparison between the Pacific and S&SE Asia could provide some useful insights. I haven’t done that yet as there is a lot of manual work required to find out the location of contract implementation.
I updated AECOM to AECOM (now DT Global) and Scope Global to Scope Global (now Palladium). Thank you for pointing that out. Cardno and DT Global are treated as separate because we think they are still competing with each other for the contracts before the acquisition. Same rule applies to other companies.
Thanks Sharon. Yes I can only imagine the amount of manual work it took to pull out this data! It would be good if this information was more transparently and accessibly shared.
Some of the requirements around national interest etc feel like they are drawn from the broader APS requirements on procurement, rather than specifically for DFAT, so I’m not sure how much weight they have. Others would probably know more than me. But it would be harder to make the argument of national interest without any Australian ‘base’, for example.
And in my own comment, just clarifying I meant large aid management companies/’Global North’ companies based outside Australia in my remark on Pacific expertise, of course there are many highly experienced Pacific-based companies of various sizes.
I see. Thanks Ashlee for the clarification.
Hi – thanks and important analysis. Note that Scope Global was integrated into Palladium effective from 1 March 2022, so you may need to update the 2021-22 column to combine the two entities, and perhaps clarify in the body of the article? Separately, it may be worth clarifying that the Alinea contract volume reflects the pass-through of a large amount of funding to NGOs under the Australian Humanitarian Partnership? A final comment: it would be interesting to examine the various ownership structures of these for-profit aid contractors to understand where and how financial benefits flow. Most are not publicly listed companies and are private shareholder vehicles.
Those figures absolutely include grant funds we administer. Each is listed as a separate contract on Austender, but we don’t receive any portion of those grants. That possibly skews some of the other figures too, but hard to know without going into each contract. I can certainly say we wouldn’t be on that top 10 list (or close to) once they are excluded.
Really interesting article, and the lack of movement in the top tier firms. It would also be fascinating to see what portion of work funding is sub-contracted to local companies. While this data isn’t readily available, DFAT has more data on value-chain trends from PERFORMS, which will hopefully be visible in the future.
And thank you Thomas. As mentioned in my reply to Darian, I added a note and hopefully this would clear up doubts. It is very hard to go through the contracts to check if similar funding structures apply. Aid contracting market is an important topic. I do hope that as the new government places more emphasis on transparency, we will see more information and data being made public.
Hi Darian. Thank you. That’s an important point. I’ve double-checked with my colleague Cameron Hill. And I’ve added the following note to the table “Note that contract value also includes funds transferred to NGOs through contractors. For example, Alinea transferred a large amount of funds to NGOs under the Australian Humanitarian Partnership (AHP) and its AHP contracts have a total value of 191.8 million AUD in 2021-22.” Thank you for the comment. We’ll consider that as we go further into the analysis.
Great job, Sharon. This is an important topic.
An interesting follow-up would be to look at the levels and changes in profitability of these firms over this time, as these are quite large structural changes in the market.
Thank you Ryan. The topic definitely deserves more exploration.