Party politics in Papua New Guinea are complex and often appear incomprehensible. In this post I use data from the last three elections to explain some key features of PNG’s party landscape.
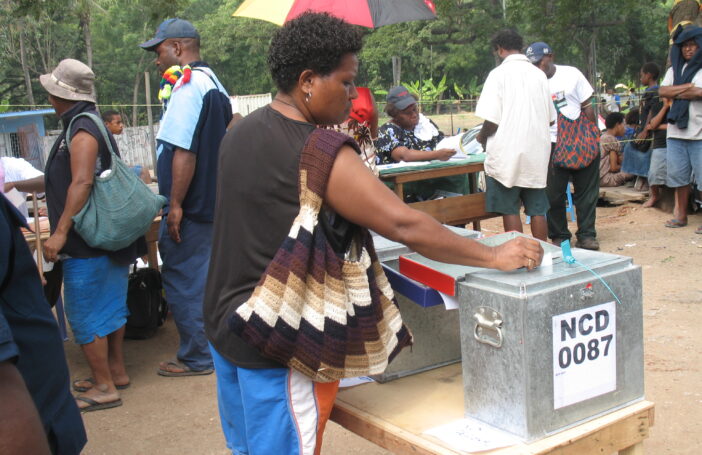
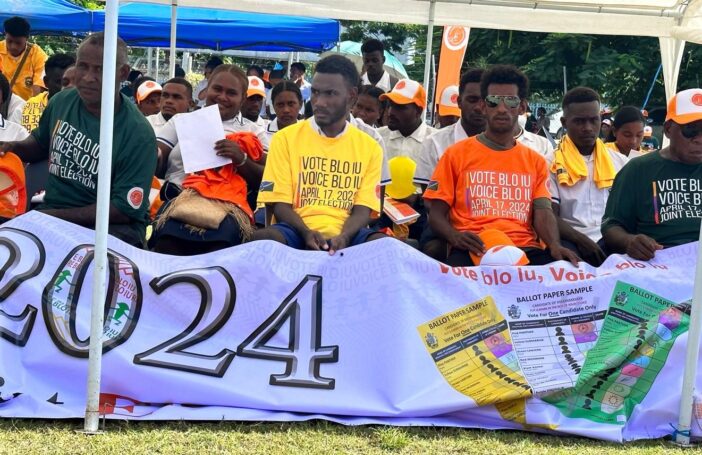
The share of candidates affiliated with parties in PNG has always been low, and the years since 2012 have been no exception. Parties endorsed just 36%, 44% and 36% of all candidates in the 2012, 2017 and 2022 elections, respectively. This isn’t because of a shortage of parties though. In all three elections, more than 40 parties stood candidates. In 2022, 52 parties contested the elections, yet that didn’t stop the share of candidates standing with party backing from falling to just 36%. There are plenty of parties, but most candidates compete without their support.
Although most candidates aren’t affiliated with parties, most winners are: the share of winning candidates who were backed by a party averaged 88% in the last three elections, and reached a high of 91% this year.

In the past three elections, lots of parties have contested, but a much smaller number have been successful. 42 parties contested in 2012 and 2017, but only 21 had candidates elected. This year, despite 52 parties contesting, only 23 had any electoral success.
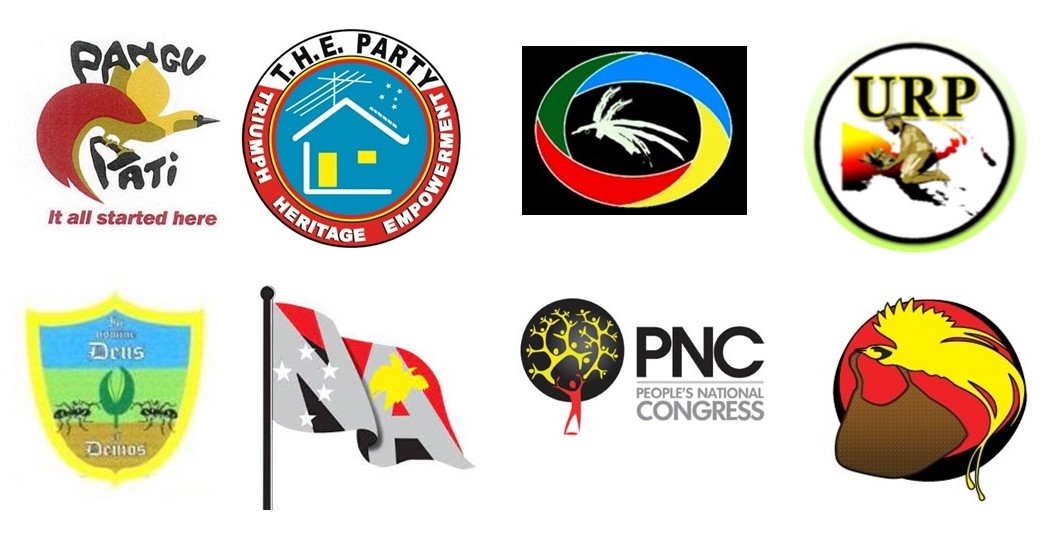
What is more, many of the parties that have had candidates elected in the last three elections have been short-lived. Only 11 parties had successful candidates in all three elections, namely: National Alliance (NA), Our Development Party (ODP), Papua and Niugini Union Pati (PANGU), People’s Movement for Change Party (PMCP), People’s National Congress (PNC), People’s Party (PP), People’s Progress Party (PPP), PNG Party (PNGP), Social Democratic Party (SDP), Triumphant Heritage Empowerment (THE) party, and the United Resource Party (URP). Taken together, these 11 regularly elected parties were also the source of most of the successful candidates, being home to a total of 74 successful candidates in 2012, and 83 and 86 winners in 2017 and 2022, respectively.

The number of candidates endorsed by these 11 parties varied between 2012 and 2022, but most of them have endorsed significant numbers of candidates in each election, as can be seen below.

It is interesting to examine the ratio of wins of each party to the number of candidates it endorsed. PANGU had the highest success rate of the 11 regularly elected parties this year, 48%. However, over 2012 to 2022, PNC had the highest average success rate, 27%.
Between 2012 and 2022, the incumbent ruling party has always emerged from elections the most successful party in terms of both the total MPs selected and the proportion of its candidates who were elected (PNC in 2012 and 2017, and PANGU in 2022). Outside the ruling party, URP’s success rate improved the most.

There is a positive correlation between candidate numbers and electoral success rates (r = 0.36). Among those 11 parties that have stood candidates in the last three elections, parties that fielded more candidates were also home to more successful candidates. The chart below shows this, for all the 11 parties over the last three elections.

This is an interesting finding. Perhaps larger parties have more money, which enables them to both stand more candidates and give them more funding to campaign with. Or perhaps stronger candidates tend to group together in parties which end up more successful. Learning more about this aspect of party dynamics will make for interesting future research.
The role played by parties in PNG is very different from that in countries like Australia. Indeed, many parties come and go from election to election in PNG, often small and unsuccessful. Nevertheless, parties are important. Successful candidates are much more likely to come from parties. And the larger, well-established parties tend to be home to the candidates who are most likely to succeed.

