It is widely asserted that two important groups of developing countries are losing out on aid. These are the Least Developed Countries (LDCs) and the 27 non-LDC countries (other than China and India) that have graduated from low- to middle-income country (MIC) status since about 2000, which I am calling the ‘transition’ countries.
The first instalment of this four-part series quoted various expressions of concern about the purported decline in aid to one or the other of these country groupings, elaborated on the membership and characteristics of the transition country grouping (which, unlike the LDC grouping, has no conventional standing) and provided an initial overview of aid flows to these two groupings over the past three decades. This second instalment looks specifically at aid to the LDCs, and finds no current grounds for concern.
In measuring aid to the LDCs, the OECD most often includes not only bilateral flows to them from the member countries of its Development Assistance Committee (DAC) but also ‘imputed’ multilateral flows. The idea is straightforward enough: if a donor allocates say 5% of its aid to a multilateral organisation that on average allocates say 50% of its spending to LDCs, then that donor may be considered to have allocated 0.05 x 0.50 = 2.5% cent of its aid to LDCs.[1]
Taking this approach, the OECD has estimated a preliminary total for aid to the LDCs in 2014 that has fallen relative to 2013 but is within the range of normal year-to-year variability—as illustrated by chart 3 of its own April 2015 press release, reproduced below. This chart was widely circulated together with the claim that ODA to the LDCs had ‘continued to fall’, despite the fact that the chart does not in itself lend any support to what is inherently a multi-year judgement.[2]
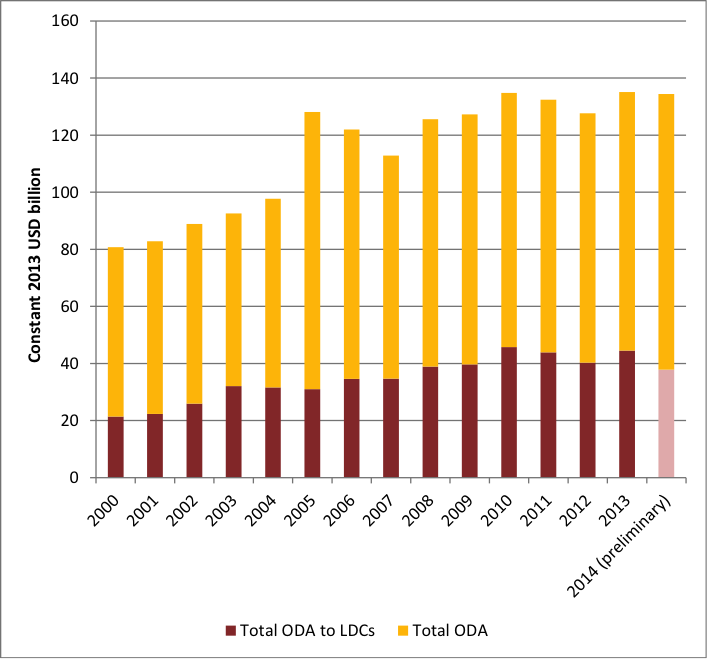
Source: DAC press release on preliminary 2014 ODA estimates, chart 3
It might be assumed that the OECD’s claim was in fact based on a consideration of purely bilateral aid allocations, sans imputation. According to its preliminary data, DAC bilateral aid to the LDCs fell by 16% from 2013 to 2014, or 8% per cent if exceptional debt relief to Myanmar is excluded from the 2013 total. However, purely bilateral effort on the part of DAC donors actually shows no clear downward trend in recent years whether viewed in dollar, share-of-ODA, ODA/donor-GNI or ODA-per-head-of-recipient-population terms. Still less is there any evidence of a downward trend in total LDC aid receipts.
Having jumped from US$26 billion in 2009 to just under US$30 billion in 2010 (2012 prices), DAC bilateral aid allocations to the LDCs for the following three years were US$30.6 billion, US$27.5 billion and US$29.5 billion. The preliminary estimate for 2014, if 8% lower than the 2013 outcome, must be US$27.1 billion. No trend is evident; just some bouncing around.
The story is similar in relation to total aid from all sources on whom the OECD holds reasonably good data—DAC donors, some non-DAC bilateral donors and multilateral organisations. Having jumped from US$42.5 billion in 2009 to US$46.3 billion in 2010, the amounts for the following years were US$44.8 billion, US$43.1 billion and US$47.3 billion. Again, there is no trend.
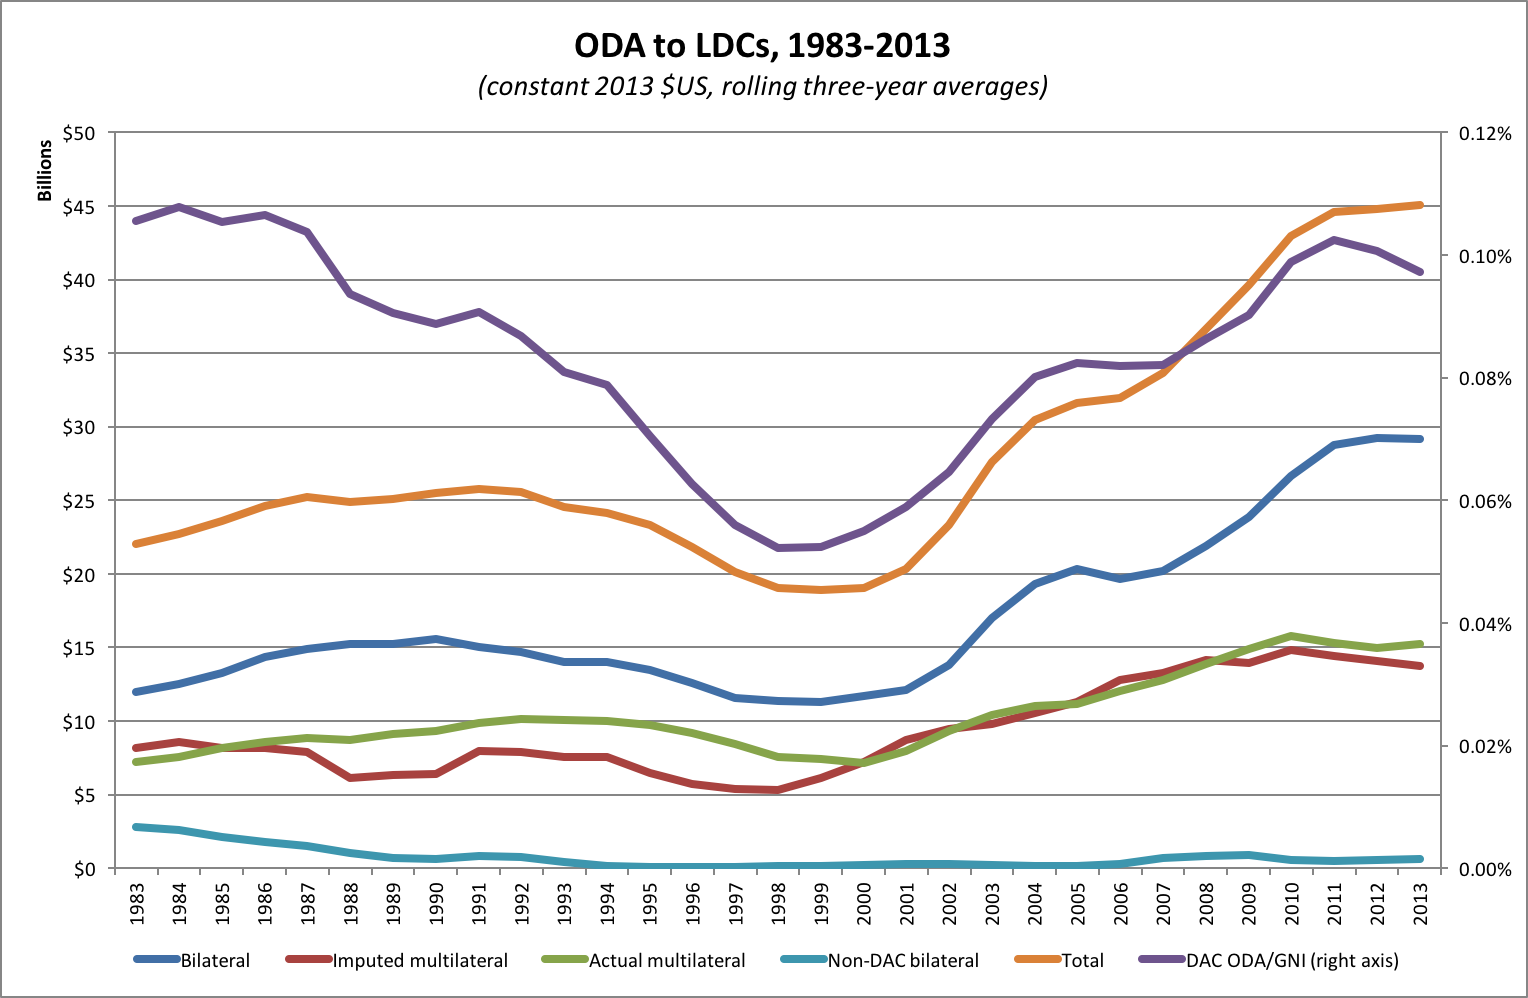
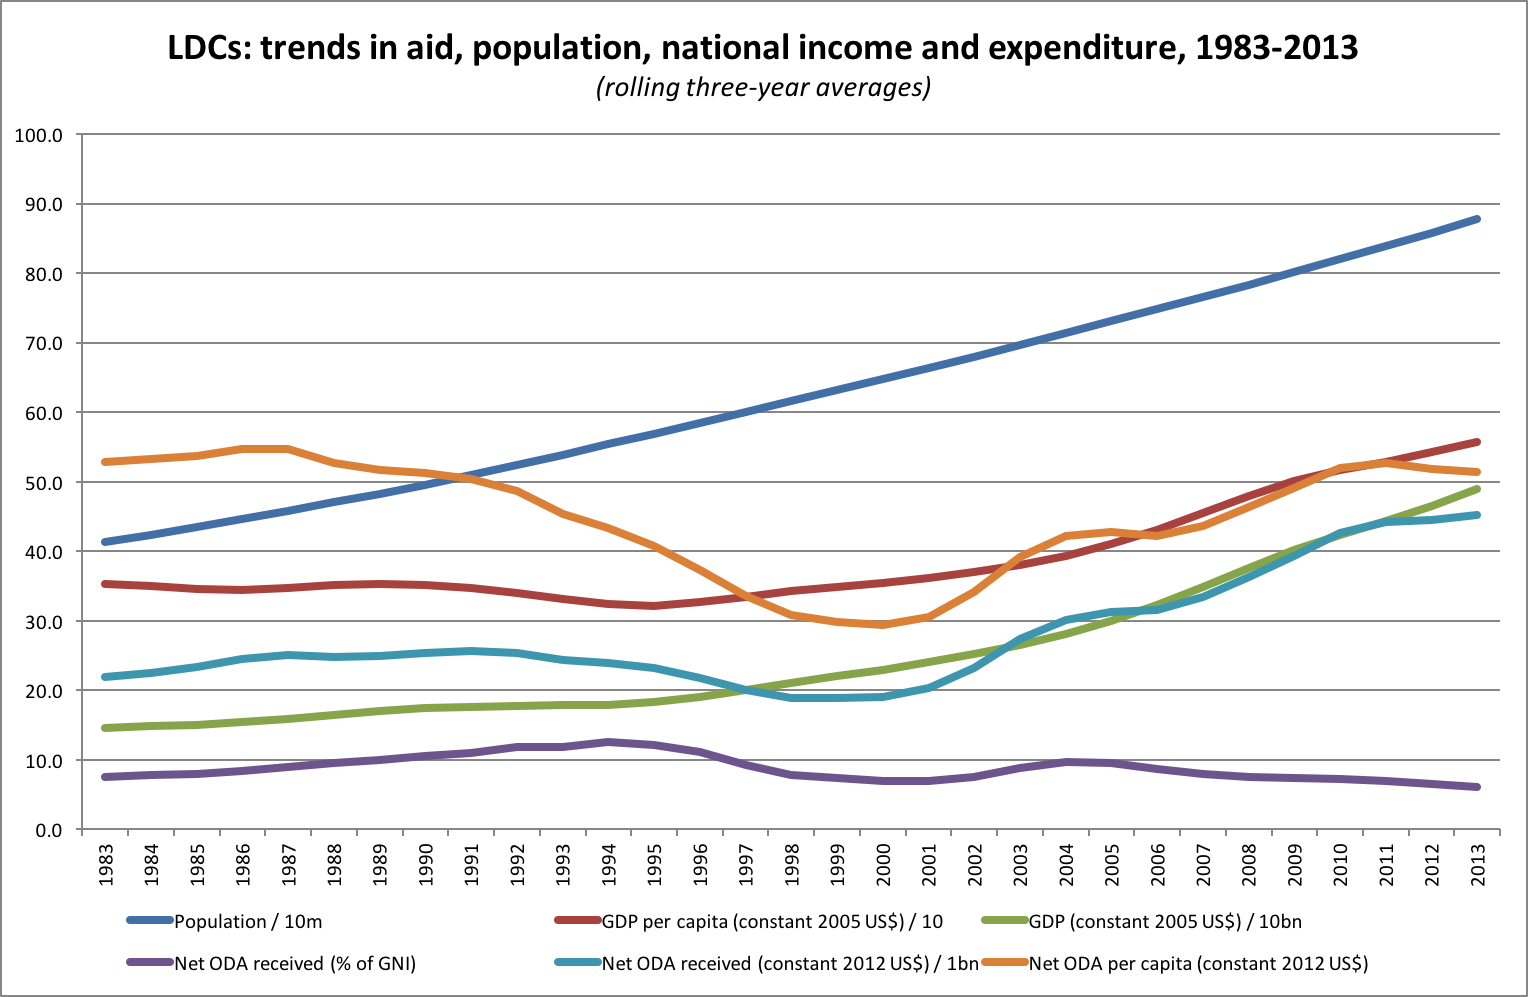
Taking a longer-term perspective, ODA to the LDCs has for the most part been growing strongly since it emerged from a strikingly deep trough in the late 1990s. The three-decade picture, with annual variations slightly smoothed, is shown below with total ODA represented by the orange graph. The most that could be said, on the basis of this picture, is that the growth of aid to the LDCs is currently decelerating and perhaps that the level of aid to them is plateauing.
As a proportion of DAC donors’ combined GNI (right axis above), DAC aid to the LDCs has fallen slightly in each of 2012 and 2013, relative to the recent high achieved in 2011, but only at the third decimal place. At just over 0.1% it stands at only two-thirds of the LDC aid volume target to which many donors have subscribed (at least 0.15% of donor GNI). Neverthless, it is in a range not seen since the 1980s.
In share-of-ODA terms, DAC bilateral effort, as shown in the table below (data not smoothed), doesn’t show any trend at all.[3]
 From the figures above we can see that the Addis Agenda’s assertion which was quoted in the previous post, that the LDCs’ share of ODA has fallen, achieves correctness by the skin of its teeth in relation to total aid to the LDCs if one selects any of 2010, 2011 or 2012 as the baseline year. However, this means nothing given that the component allocations of all three categories of donor evidently show no clear trend over the past five years.
The three-decade picture of aid to the LDCs as a share of the total aid receipts of developing countries is as shown below, with all-source ODA represented by the purple graph.
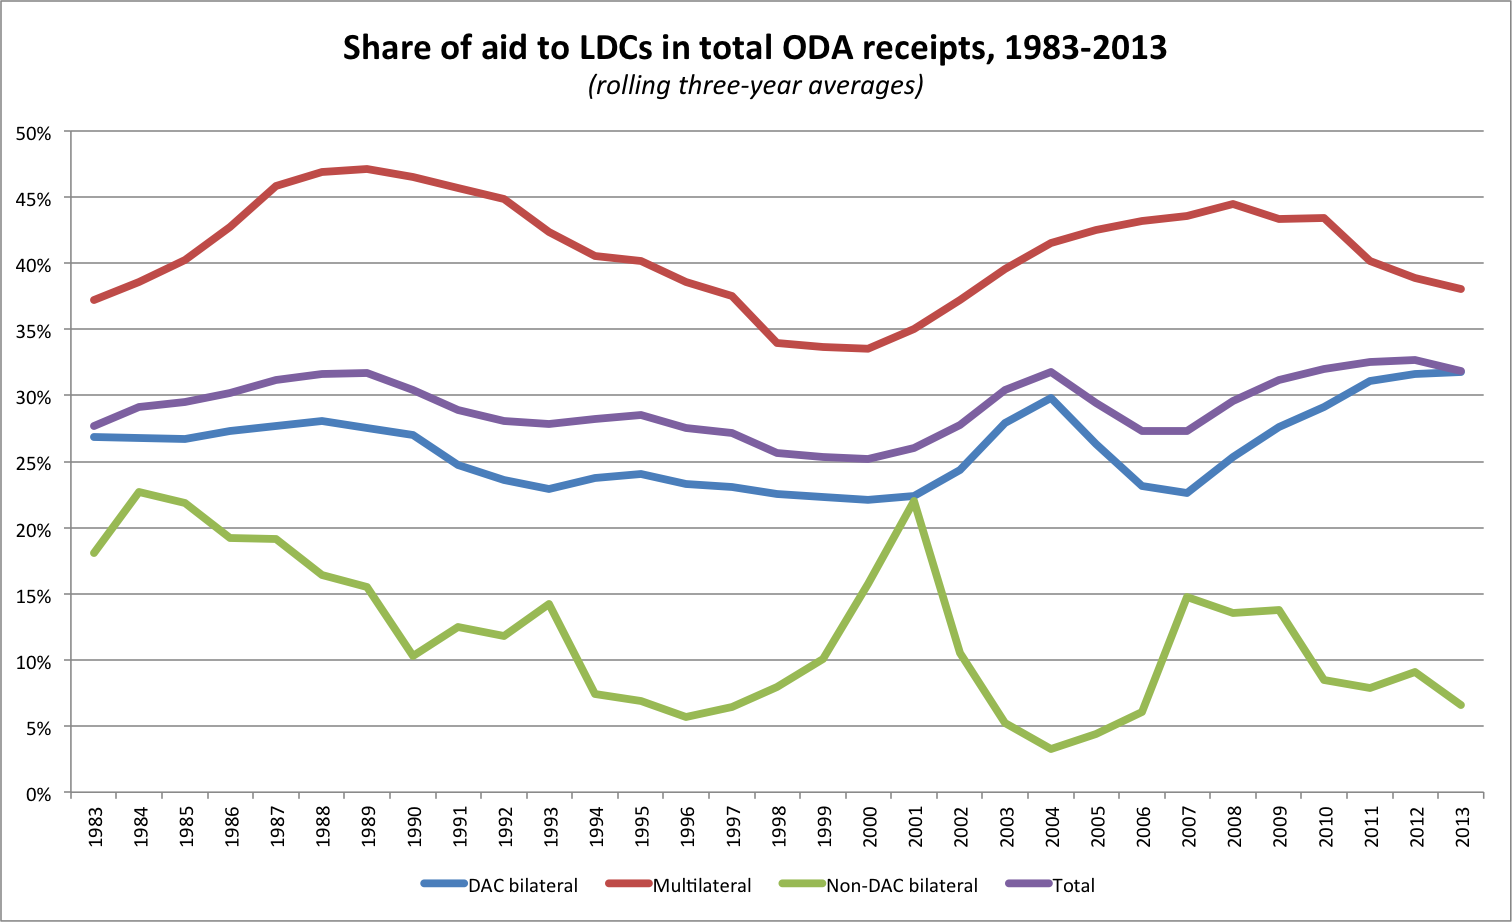
If anything, the historical data suggest that there has been an upward medium-term trend in the share of DAC bilateral aid allocated to the LDCs in total bilateral ODA, starting in 2007, which has driven an upward trend in total ODA to the LDCs. This might now have peaked or plateaued, but there is no way to be sure of that.
As for the LDCs’ aid receipts per capita—represented by the orange graph in the chart below—those have increased sharply since the great LDC aid trough at the turn of the century, from about US$30 at the low point in 1999 to about US$52 in 2013 (2012 prices), almost equal to the highest level reached since 1983, which was US$55 in 1987.
Again, the most that could be said about the the LDCs’ per capita receipts is that their growth has decelerated and that they might have plateaued. However, the same conclusion might have been reached around 2006, after which their growth actually resumed.
It should be obvious that fluctuations in the level of aid to the LDCs from year to year have to be viewed with particular caution. By definition, countries in this group are exposed and vulnerable to various shocks which leads to considerable variations in levels of aid received by individual LDCs. For example, there were quite substantial spikes in ODA to Haiti in 2010 after the earthquake, to the Democratic Republic of the Congo in 2011 after the Horn of Africa drought and famine, to Myanmar for debt relief in 2013 and to Burkina Faso for debt relief in 2003. Because a large share of donor funding for the LDCs comes from emergency and humanitarian budget allocations, it can and does move around fairly quickly. It might move around within the LDC grouping without necessarily altering aggregates, or it might move between LDCs and other countries, causing volatility in aggregates.
Overall, then, it seems that the LDCs—contrary to what many people seem to believe—are not currently losing out in the global aid allocation process, though some individual countries might be, and though collectively the LDCs might deserve to be partaking of a larger global aid pie. The third instalment in this series will show that the same is true of the transition countries.
Robin Davies is the Associate Director of the Development Policy Centre.
This post is the second in a four-part series on development finance flows to least developed countries and transition countries. You can access all four posts in the series here.
[1] The OECD’s method for calculating total aid to LDCs, while logical enough, can be confusing. It gives a total that is equal neither to bilateral receipts nor to the sum of bilateral and multilateral receipts, since total multilateral outflows to LDCs in a given year might in fact be larger or smaller than the sum of the imputed inflows to multilaterals (as is evident in the second of the charts above). It is intended to measure donor effort, and it measures that variable more precisely than it measures recipient benefit.
[2] Those concerned about the ‘continued’ fall might be happy to hear that the OECD’s regular survey of DAC donors’ forward spending plans indicates a likely increase in aid to LDCs over the several years ahead. If that prediction is accurate then we have even less reason to believe that there has been a sustained fall up to 2014. However, the survey in question has not been a reliable predictor of ODA volume and allocation changes in the past and is likely to be even less reliable in relation to such a high-risk group of countries, who receive much of their financing from flexible, short-term funding allocations. In addition, the subject of the survey is ‘country programmable aid’ (CPA)—approximately the aid that actually crossed borders into developing countries for non-emergency purposes—rather than ODA. The average LDC receives less of its ODA as CPA than does the average developing country.
[3] As pointed out in note 4 of the previous post in this series, up to one-third of bilateral aid is not attributed to individual countries by donors, being reported to the OECD under catch-all headings such as ‘Asia regional’ or ‘Developing countries, Unspecified’. The LDC ODA shares indicated above represent the total amount of aid that is attributed to LDCs divided by total bilateral aid. Obviously some unknown amount of the bilateral aid that is not attributed to specific countries will also benefit LDCs.


Leave a Comment