

In a recent Devpolicy exchange on Pacific migration, Naren Prasad worries that reliance on migration and remittances will weaken domestic capacity. Stephen Howes responds that a Pacific with more migration opportunities is clearly better off than one with fewer, because migration raises incomes for the people who stay behind. Both sides draw on national figures, such as remittances as a share of GDP and income per person. National figures show how much money arrives, but not which households receive it.
The Marshall Islands 2019–20 Household Income and Expenditure Survey shows what those totals miss. Remittances reached 43% of people in the poorest 20%, while state social assistance reached 25%. Yet the poorest group received only 10% of total remittances, against 40% of total state assistance. Household data from Solomon Islands, Micronesia and Fiji show the same pattern: remittances reach far more poor households than their share of the money would suggest.
The World Bank’s Atlas of Social Protection Indicators of Resilience and Equity (ASPIRE), which assembles social protection and transfer indicators from household surveys, lets us compare the reach and amounts of these transfers across Pacific countries. ASPIRE sorts people into five equally sized groups, or quintiles, by their household’s consumption per person before any transfers. Ranking households before transfers could in principle make remittances look better at reaching the poor than they are, but in these data the post-transfer picture is very similar. For Micronesia, whose data come from a 2000 census, ASPIRE ranks households by income instead.
ASPIRE reports two measures: coverage, the share of people in each group whose household received a transfer of any amount, and benefit incidence, each group’s share of the total amount transferred. Five of the ten Pacific island countries in ASPIRE report data on both remittances and state assistance: Fiji, Solomon Islands, Micronesia, the Marshall Islands and Kiribati. Fiji has two surveys, in 2008 and 2013, so that gives six surveys in all, as shown in Figure 1.
Figure 1: Share of each group receiving remittances and state assistance
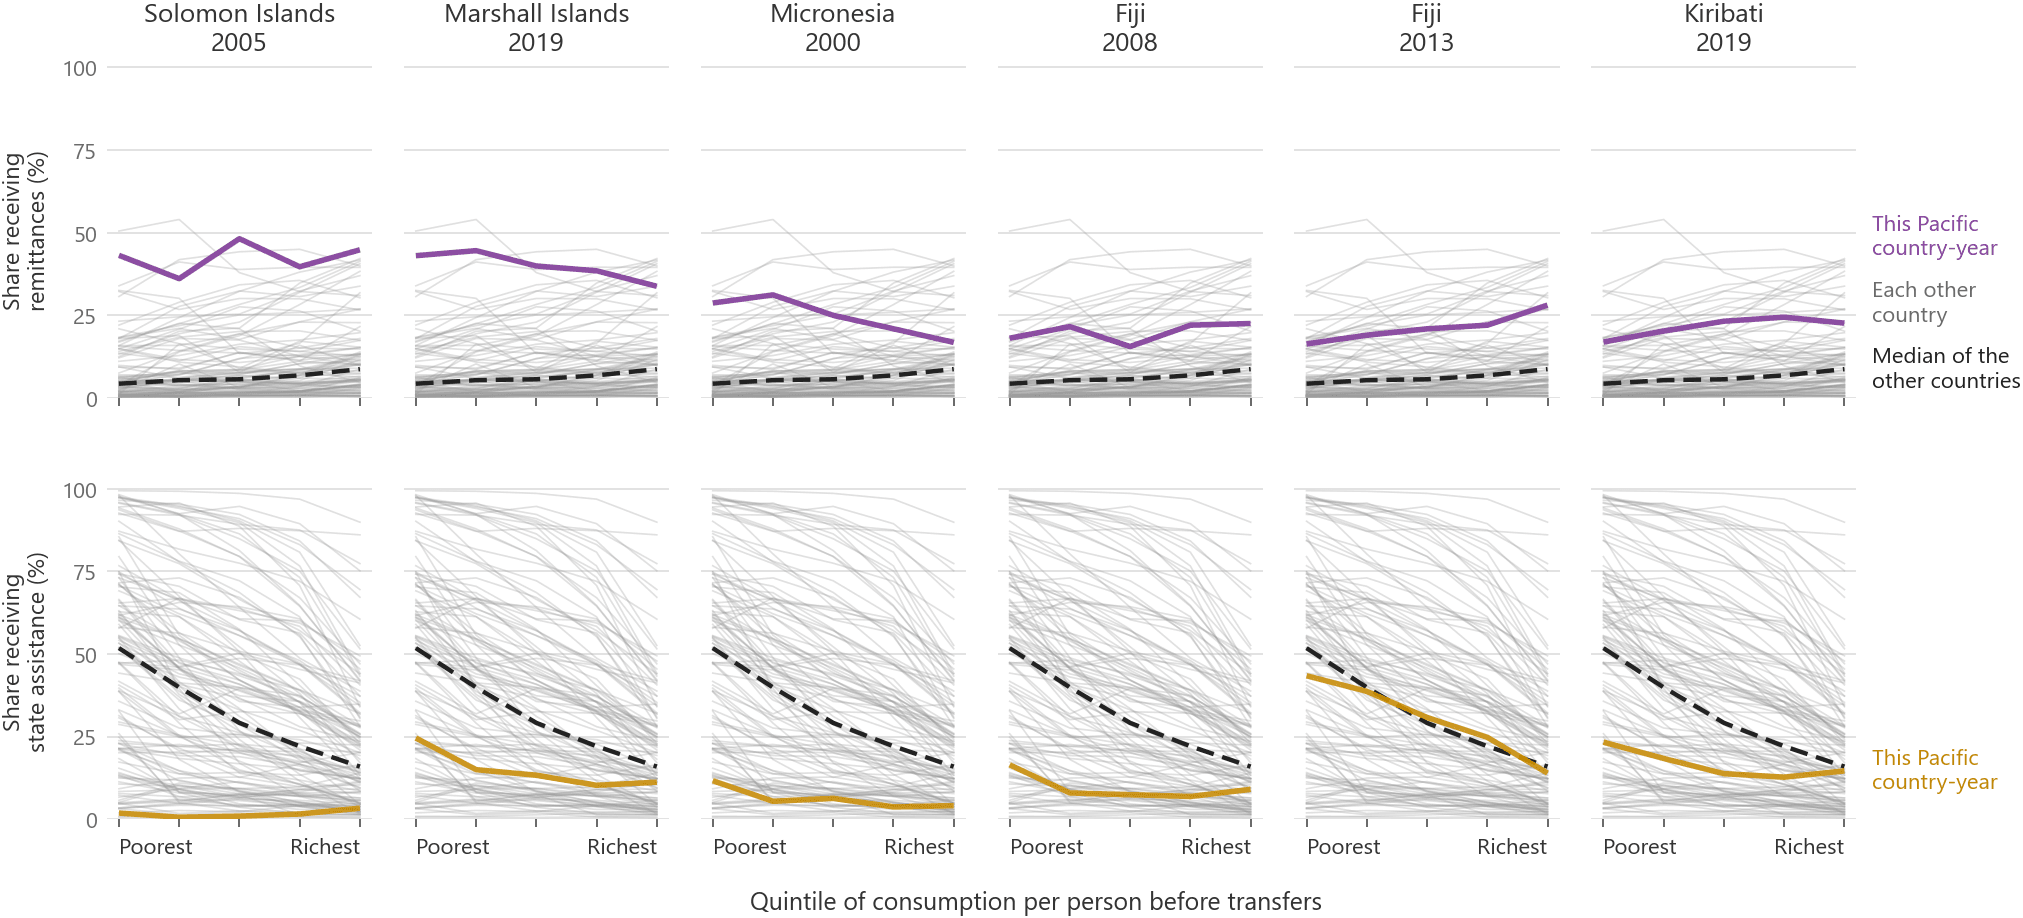
Figure 1 shows that remittances reach unusually far down the distribution in these Pacific countries. Across the 93 other countries with remittance data, only 4% of the poorest group receives remittances in the median country. The six Pacific surveys are all between the 85th and 99th percentiles.
Remittances also reach more people in the poorest group than state assistance does in four of the six surveys. The starkest contrast is Solomon Islands in 2005, where 43% of the poorest group received remittances and only 2% received state assistance. In 2008, 18% of Fiji’s poorest received remittances and 16% received state assistance, and by 2013 the state reached more people in the poorest group than remittances did. In Fiji in 2013, subsidies reached 33% of the poorest group but were worth about 4% of recipients’ consumption, while cash transfers reached 12% and were worth about 11%.
Coverage tells us little about how much households receive. That is measured by benefit incidence, shown in Figure 2 for the same five countries. ASPIRE reports amounts for state assistance in Kiribati but not for remittances, so Kiribati appears in Figure 2 for state assistance only.
Figure 2: Share of total transfers and share of consumption by quintile
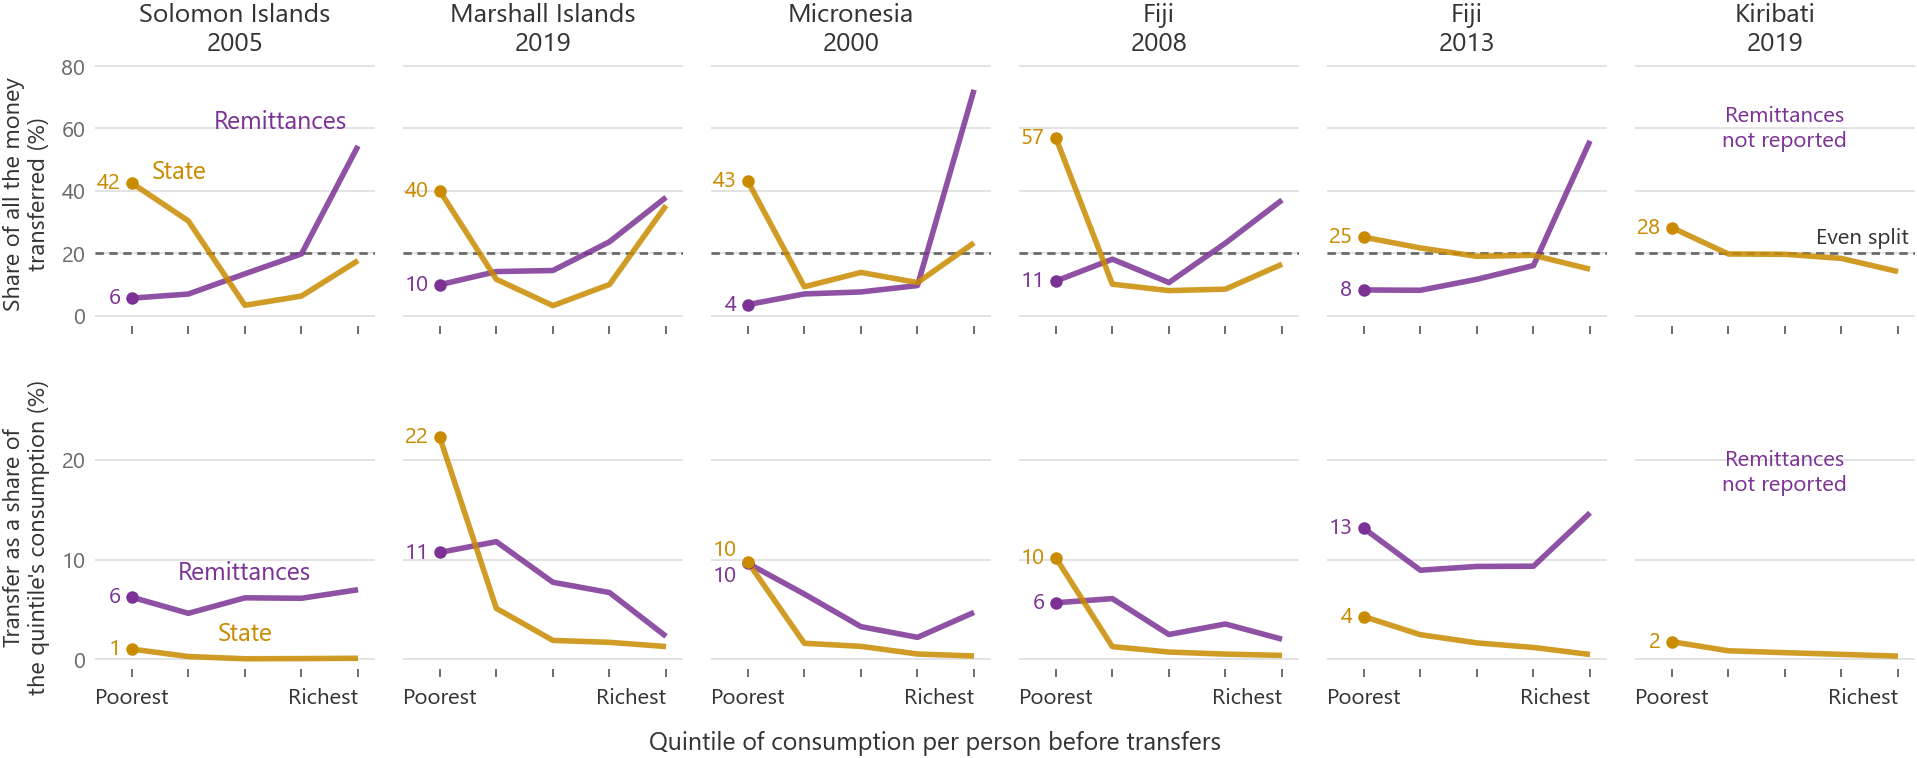
In the five surveys that report remittance amounts (all but Kiribati), the poorest group gets just 4% to 11% of all remittance money, while the richest group gets between 37% and 72% (Figure 2, top row). The top of that range is Micronesia in 2000, the one survey ranked by income rather than consumption; the other four sit between 37% and 56%. For state assistance, in contrast, people in the poorest group receive 25% to 57% of the total. So remittance money is concentrated among richer households, while state assistance sends a much larger share to the poorest households.
That concentration is not unusual. Because migration involves substantial up-front costs, remittance income flows disproportionately to better-off households almost everywhere. Across the 91 other countries with incidence data, the richest group receives a median 47% of remittance money, and four of the five Pacific surveys with remittance amounts sit between the 32nd and 66th percentiles of that distribution. So the Pacific is typical in how concentrated remittance money is, and unusual in how far down the distribution it reaches.
Remittance amounts are much larger overall than state assistance, so even a small share can be worth as much to the poorest households as state assistance is (Figure 2, bottom row). Across the poorest group as a whole, remittances add up to 6% to 13% of pre-transfer consumption, counting households that receive none, compared with 1% to 22% for state assistance.
Remittances are worth more in Solomon Islands in 2005 and in Fiji in 2013, state assistance is worth more in the Marshall Islands and in Fiji in 2008, and the two are about equal in Micronesia. In Fiji in 2013, people in the poorest group received 8% of remittance money and 25% of state assistance, yet remittances were worth 13% of their consumption and state assistance 4%.
In most countries, remittances barely reach the poor. In these Pacific countries they are a substantial source of income for poor households.
Some caveats should be registered: three of the six surveys predate the recent growth in Pacific social assistance, so current coverage and incidence may differ. Among the countries that provide social assistance benefits, spending has grown from 0.9% to 2.3% of gross national income since 2013, according to Jesse Doyle and Charles Knox-Vydmanov. ASPIRE does not capture money sent to churches or villages, nor does it count state transfers to communities. Standard household surveys may also mismeasure remittances.
Why the poorest households receive so small a share of total remittances is a question about migration that is relevant beyond the Pacific. Michael Clemens and Timothy Ogden describe migration as an investment in household finance. If constraints affect where migrants from poor households end up, the visas they get, or the jobs that they hold, this might shape how much money they can send home. Testing this needs data that follow migrants who send money home, recording where they work, their visa types, jobs and earnings, as well as how well off their sending country household is.
The Pacific Labour Mobility Survey collects data like these for workers in Australia’s and New Zealand’s labour mobility schemes and their households in Kiribati, Tonga and Vanuatu. Linking household surveys from other Pacific countries to the records of these schemes could extend this to more of the region.
Newer surveys could also update the patterns in this post. Most of the ten countries have since fielded household surveys covering income and spending, but many are not public. Without them, we won’t know whether the gap between remittances and state assistance for the poorest households has narrowed or widened as state assistance has grown.
The distributional data are more consistent with Howes’s case than national figures are, because they show that migration income reaches many poor households in these countries. But the gains are still regressive in absolute terms, as they are everywhere. The policy question that follows is how state assistance should be designed to complement what remittances already do for poor households, not whether remittances can take its place.




RSE source countries have often taken a relatively passive role in recruitment policy, while employers have tended to recruit from communities that are easier and less costly to access. Samoa’s recent reforms are a positive attempt to broaden participation by creating more opportunities for communities that have historically been under-represented in labour mobility schemes.
Other Pacific countries face greater practical barriers, particularly where potential workers live on remote outer islands. These barriers may help explain why remittances reach many poorer households but remain concentrated in absolute value among better-off households.
This distributional issue may be reinforced by international procurement requirements, including the Employer Pays Principle, under which employers meet migrant recruitment costs, including travel. Although the principle protects workers from recruitment debt, it can also make distant countries and communities more expensive to recruit from and therefore structurally less competitive. If labour mobility is intended to reach poorer and under-represented households, policy settings may need to offset these access costs rather than leave them entirely with individual employers.